GA4 Conversion Tracking: Complete Setup Guide (+ 7 Accuracy Tips)

Learn effective GA4 conversion tracking techniques to boost your analytics skills and drive success. Read the guide for practical strategies today!
Ever spent hours configuring GA4 conversion tracking only to question if your data is even accurate?
You're not alone. Google Analytics 4's event-based tracking system forces marketers to manually configure every conversion event—a tedious process prone to errors and data gaps.
This comprehensive guide will walk you through:
- Setting up proper conversion tracking in GA4 from scratch
- Solving common data accuracy challenges that plague most setups
- Implementing expert techniques to ensure your conversion data is reliable
P.S. While GA4 requires manual setup for every conversion action, tools like heatmapAI automatically track all revenue-driving interactions without configuration. Let's explore both approaches.
TL;DR
- GA4 conversion tracking requires manually marking events as "key events" (conversions), unlike Universal Analytics' simpler goal-based system
- Setup process: Install GA4 → create/identify events → mark specific events as key events → test with DebugView → analyze in reports
- Common challenges: Duplicate counts, 24-hour data delays, complex parameter configuration, and cross-domain tracking issues
- Pro tips: Choose the right counting method, use consistent naming conventions, leverage enhanced measurement, and implement regular data quality checks
- Limitations: No retroactive conversion marking, 30 conversion limit per property, and manual setup requirements
- Alternative: Tools like Heatmap automatically track all revenue-driving actions without configuration, showing exactly which elements generate the most value
Setting Up Conversion Tracking in GA4: Step-by-Step Guide
Before diving into the technical setup, let's establish a clear framework for your conversion tracking strategy.
Step 1: Identify Your Key Conversion Events
The first step is determining which user actions are truly valuable to your business. Not all interactions deserve conversion status—focus on those that directly impact your bottom line.
Examples of micro and macro conversions:
How to determine which actions to track as conversions:
- Align with business objectives: Each conversion should tie directly to a business goal
- Consider the customer journey: Include both final conversions and key milestones
- Focus on actionable data: Only track conversions you'll actually use for decision-making
For example, an ecommerce store might track:
- Purchase completions (macro)
- Add-to-cart actions (micro)
- Email newsletter signups (micro)
- Product review submissions (micro)
While a B2B company might focus on:
- Demo requests (macro)
- Whitepaper downloads (micro)
- Pricing page visits (micro)
- Blog subscription signups (micro)
Step 2: Configure Your GA4 Property
Before setting up specific conversion events, ensure your GA4 property is properly configured:
- Create a GA4 property if you haven't already:
- Go to Admin > Create Property
- Enter property details and click "Next"
- Select your industry category and business size
- Choose your business objectives

2. Set up data streams:
- Go to Admin > Data Streams
- Select "Web" for website tracking
- Enter your website URL and stream name
- Copy your Measurement ID (starts with "G-")

3. Install the GA4 tag using one of these methods:
- Add the Google tag directly to your website code
- Use Google Tag Manager (recommended for more complex setups)
- Use a CMS plugin (like MonsterInsights for WordPress)
4. Verify proper implementation:
- Use GA4 DebugView to confirm data is flowing
- Check real-time reports to see current user activity
- Confirm that basic events (page_view, session_start) are recording
Option 1: Using Predefined Events
GA4 includes several predefined events that are commonly used as conversions:
- For websites: purchase, generate_lead, sign_up
- For mobile apps: in_app_purchase, app_store_subscription_convert
To use these predefined events as conversions:
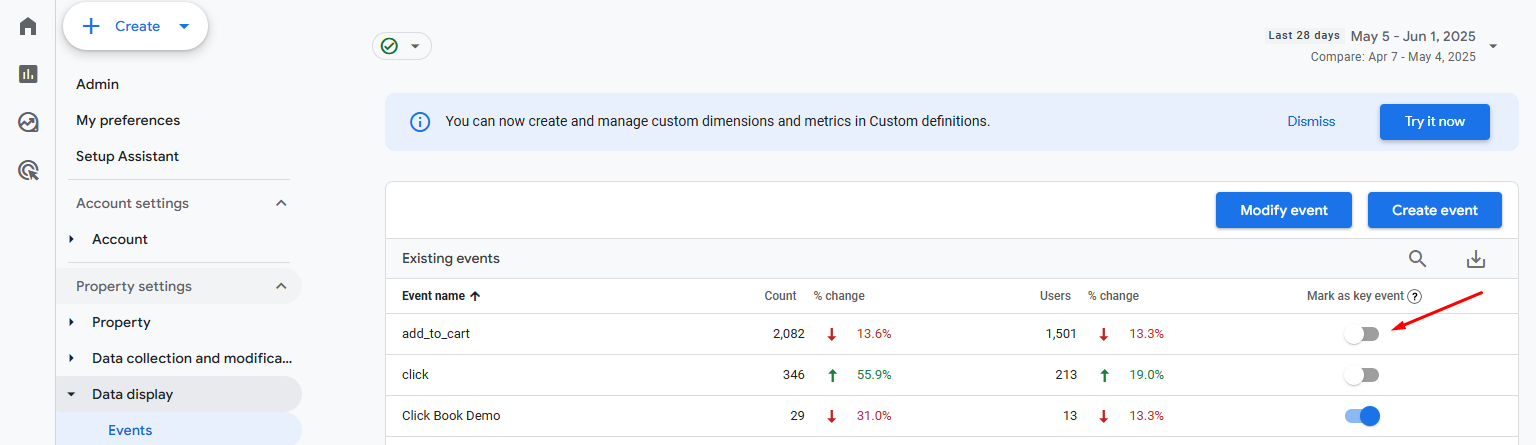
- Go to Admin > Events
- Find the predefined event in the list
- Toggle the “Mark as conversion” switch next to the event
- The event will now be counted as a conversion in your reports
Option 2: Creating Custom Events
For unique business actions not covered by predefined events, you can create custom events and mark them as conversions.
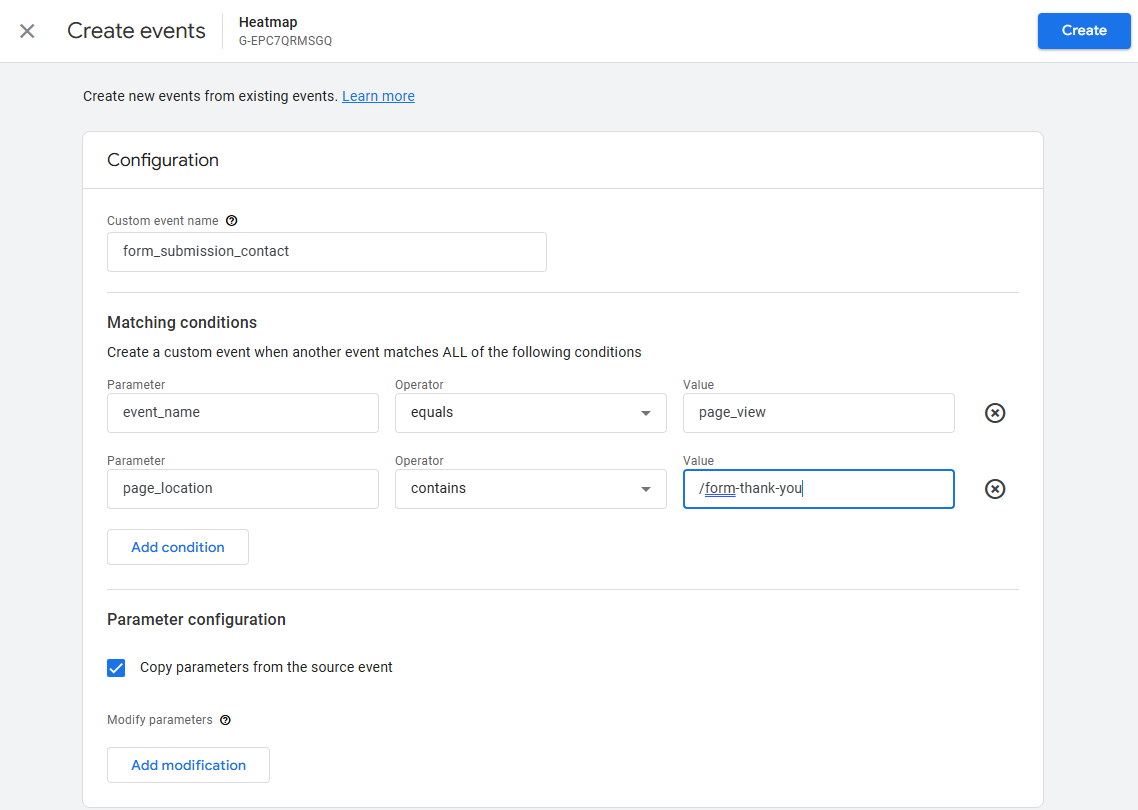
To create a custom event:
- Go to Admin > Events
- Click Create event
- Click Create to start defining your new event
- Give your event a clear and descriptive name (e.g., “form_submission_contact”)
- Define the conditions that trigger this event based on existing events and parameters
- Click Create to save the event
To mark the custom event as a conversion:
- Go to Admin > Conversions
- Click New conversion event
- Enter the exact name of your custom event
- Click Save

Step 4: Implement Event Tracking with Google Tag Manager
For more complex tracking needs, Google Tag Manager (GTM) provides greater flexibility:
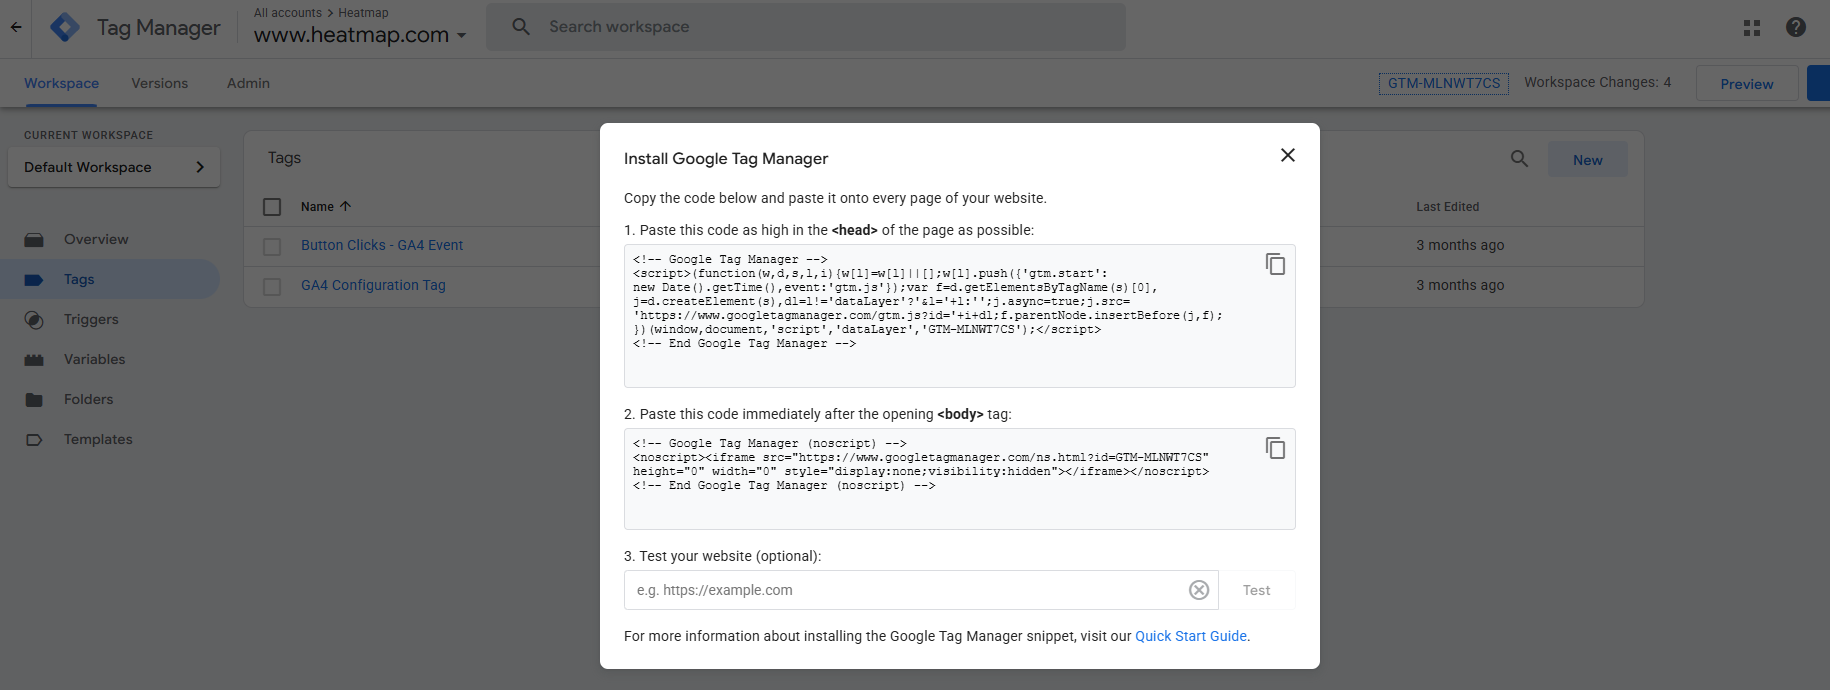
1. Set up GTM if you haven't already:
- Create a GTM account and container
- Install the GTM code on your website (two snippets: one in the <head>, and one immediately after the opening <body>)
- Connect GTM to your GA4 property by adding the GA4 Configuration tag with your Measurement ID
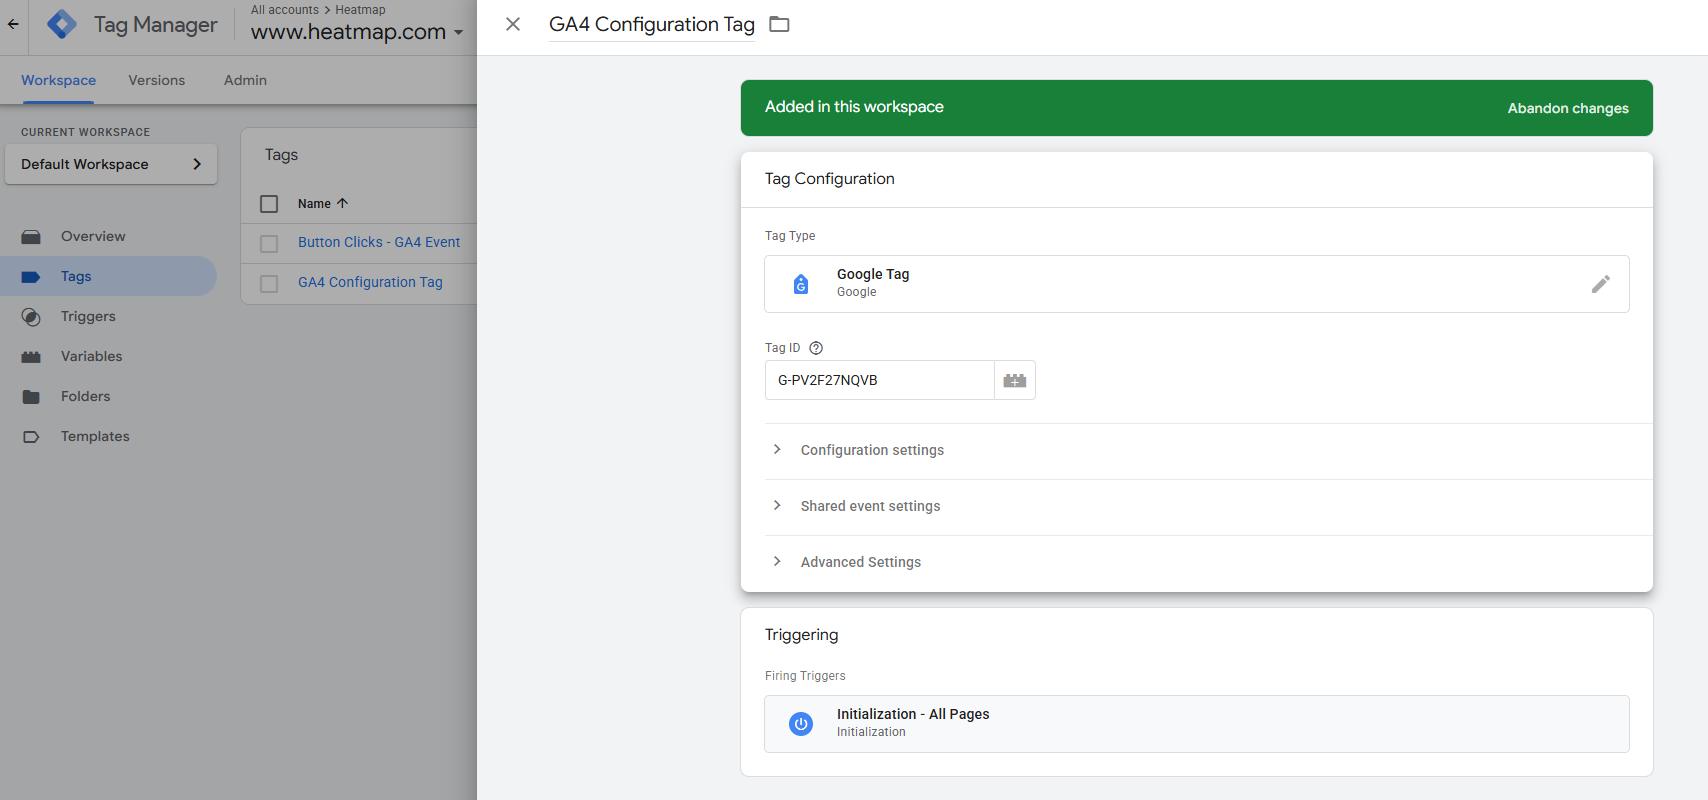
2. Create a GA4 configuration tag:
- In GTM, go to Tags > New > Google Tag
- Name it GA4 Configuration Tag
- Enter your Measurement ID (starts with "G-")
- Set the trigger to All Pages
- Save and publish
3. Create event tags for conversions:
- In GTM, go to Tags > New
- Choose Google Analytics: GA4 Event
- Enter your event name and parameters
- Set appropriate triggers (e.g., form submission event, button clicks)
- Save and publish
Example: Tracking form submissions:
// GA4 event tag configuration
Event Name: contact_form_submission
Event Parameters:
  - form_id: {{Form ID Variable}}
  - form_name: "Contact Us"
  - form_destination: {{Form Action Variable}}
Trigger setup:
- Trigger Type: Form Submission
- Condition: Form ID equals contact-form
Step 5: Verify Your Conversion Tracking Setup
After implementation, thorough testing is essential:
- Use DebugView for real-time testing:
- Go to Admin > DebugView
- Enable debug mode on your device
- Complete the conversion action on your site
- Verify the event appears with correct parameters
- Track key events (conversions) that appear with a green flag
- Check conversion reports:
- Go to Reports > Engagement > Conversions
- Confirm your events are appearing
- Verify count accuracy by comparing to your backend data
- Troubleshoot common implementation issues:
- Events not firing: Check trigger conditions and JavaScript errors
- Events firing but not marked as conversions: Verify Google Analytics key event settings
- Duplicate events: Review trigger conditions for overlap
Remember: New conversion settings only apply to data collected after configuration—they won't affect historical data.
Common Challenges with GA4 Conversion Tracking (and How to Solve Them)
Even with careful setup, several challenges commonly arise with Google Analytics conversion tracking.
Challenge 1: Duplicate Conversion Counts
Solution:
1. Adjust the counting method:
- Go to Admin > Data Display > Key Events
- Select your conversion event
- Change "Count" from "Every event" to "Once per session"
- This is ideal for lead forms, sign-ups, and other one-time actions
2. Implement technical safeguards:
- Use localStorage or cookies to prevent duplicate form submissions
- Add form validation to prevent multiple clicks
- Implement server-side deduplication for critical conversions
BTW, heatmap's conversion tracking automatically handles deduplication, ensuring accurate analytics data without manual configuration. Plus, the revenue-based heatmaps don’t just track clicks—they reveal which page elements actually boost your bottom line, empowering you to make data-driven decisions that maximize ROI and optimize user experience effortlessly.
Challenge 2: Missing or Delayed Conversion Data
Solution:
- Check for implementation errors:
- Use GA4 DebugView to confirm events are firing
- Verify that consent management isn't blocking analytics
- Ensure events are properly marked as key events
- Use real-time reports for immediate verification:
- Go to Reports > Realtime
- Complete a test conversion
- Check if the event appears in real-time data
- Implement server-side tracking for critical conversions:
- Use the Measurement Protocol for GA4
- Send conversion data directly from your servers
- This bypasses client-side blocking issues
Challenge 3: Complex Event Parameter Configuration
Solution:
- Create a parameter naming convention:
- Document standard parameters for all events
- Use consistent casing (e.g., snake_case)
- Standardize value formats (e.g., currency codes)
- Simplify parameter structure:
- Focus on essential parameters only
- Group related parameters logically
- Use consistent data types
- Use Google Tag Manager variables:
- Create reusable variables for common parameters
- Implement lookup tables for standardizing values
- Use custom JavaScript variables for complex transformations
Example parameter structure for a purchase event:
event_name: purchase
parameters:
  transaction_id: "T12345"
  value: 125.99
  currency: "USD"
  items: [
    {
      item_id: "SKU123",
      item_name: "Product Name",
      price: 125.99,
      quantity: 1
    }
  ]
Challenge 4: Cross-Domain Tracking Issues
Solution:
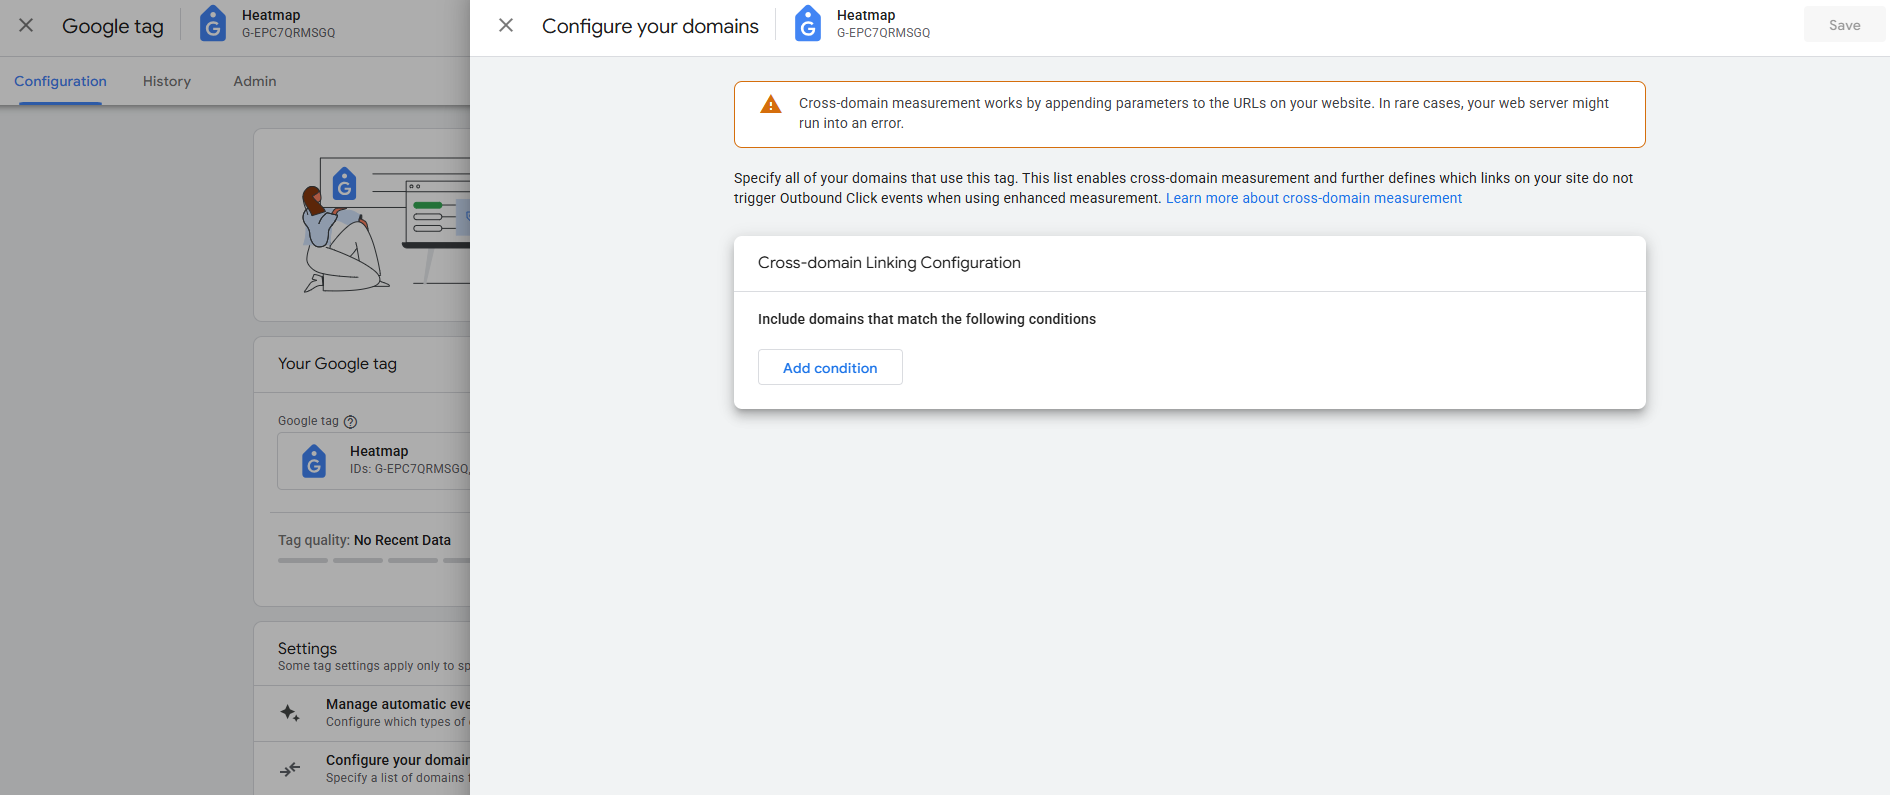
- Configure cross-domain tracking:
- In GA4 Admin, go to Data Streams > Your Web Stream
- Click "Configure tag settings"
- Under "Configure your domains," add your additional domains
- Implement proper link decoration:
- Ensure links between domains include the _gl parameter
- Use Google Tag Manager's Auto Link Domains feature
- Test cross-domain journeys to verify continuity
- Verify user journey across domains:
- Create a User Explorer report in GA4
- Follow a single user's journey across domains
- Confirm that conversion attribution is maintained
Example GTM configuration for cross-domain tracking:
// GA4 Configuration Tag
Fields to Set:
  linker: {
    domains: ['yourdomain.com', 'checkout.yourdomain.com', 'support.yourdomain.com']
  }
7 Pro Tips for Accurate GA4 Conversion Tracking
Now that you've tackled the common challenges, let's explore advanced techniques to ensure your conversion data is as accurate as possible.
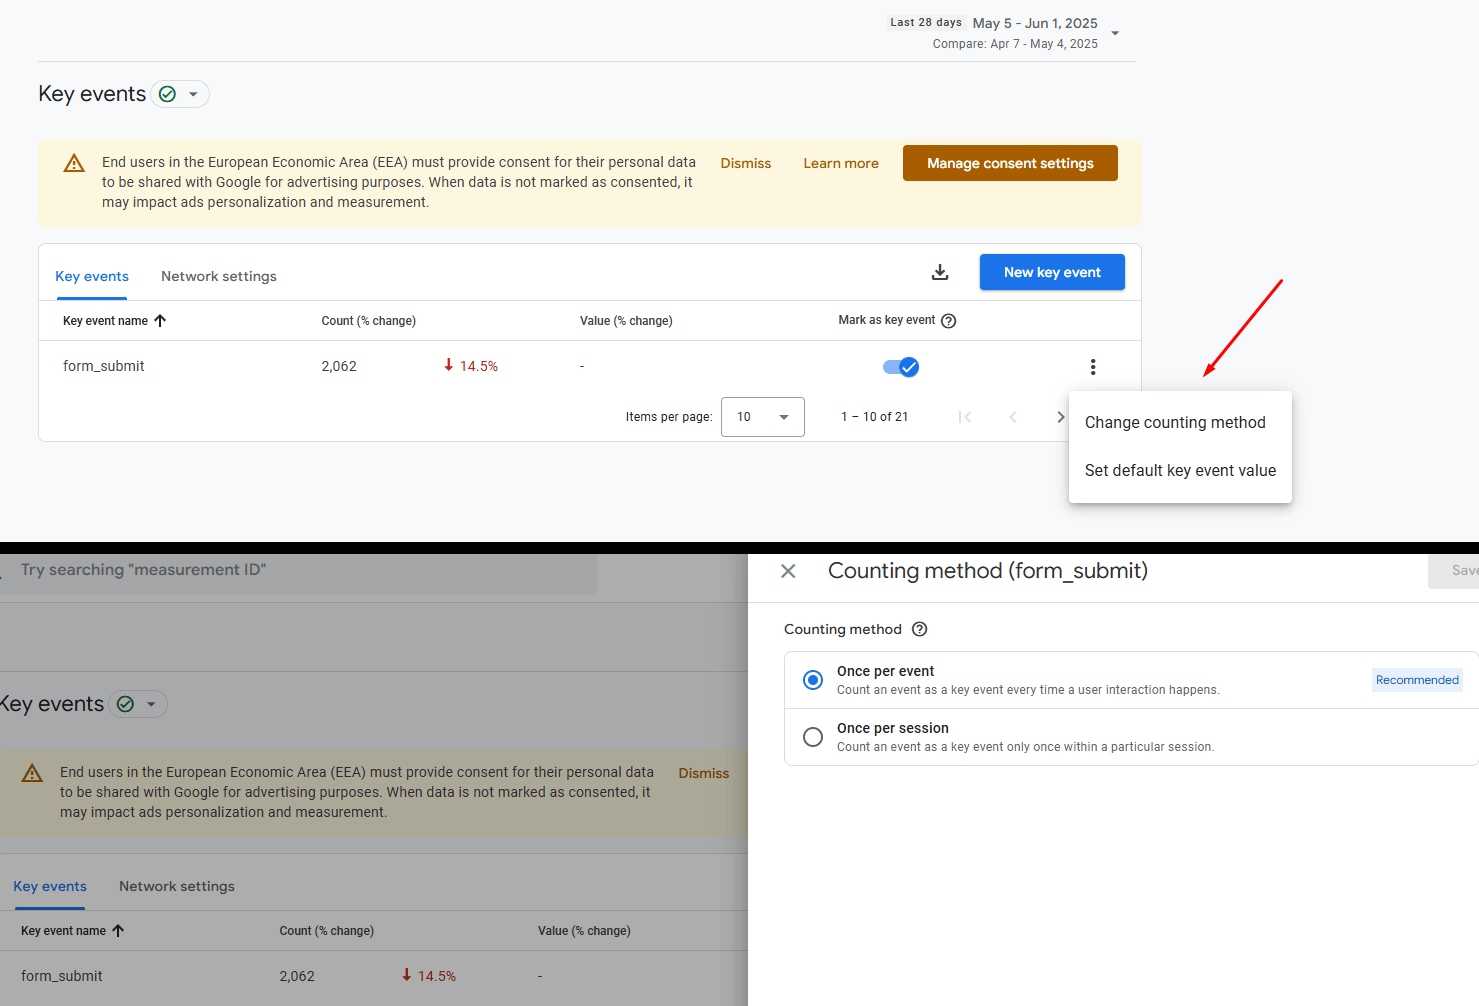
Tip 1: Choose the Right Counting Method
The counting method you select dramatically impacts your conversion metrics.
Two options are available:
- Once per event (default): Counts every occurrence of the event
- Once per session: Counts the event only once per session, regardless of how many times it occurs
When to use each method:
Implementation:
- Go to Admin > Data Display > Key Events
- Select your conversion event
- Under "Count," choose the appropriate method
- Click "Save"
Tip 2: Set Appropriate Session Timeout Settings
Session length directly affects how conversions are attributed, especially for longer customer journeys.
Default settings:
- 30 minutes of inactivity ends a session
- New campaign source starts a new session
How to optimize:
- Analyze your typical user journey:
- How long do users typically spend before converting?
- Do they often leave and return later?
- Adjust session timeout settings:
- Go to Admin > Data Settings > Data Collection
- Modify "Timeout duration" based on your findings
- For content sites: Consider longer timeouts (60+ minutes)
- For ecommerce: Standard 30 minutes often works well
- Test the impact:
- Compare conversion data before and after changes
- Look for more accurate attribution patterns
Tip 3: Use Clear, Consistent Event Naming Conventions
Organized naming conventions make analysis and reporting significantly easier.
Best practices:
- Use a hierarchical structure:
- action_object_detail
- Examples: view_product_details, submit_form_contact
- Be consistent with formatting:
- Use snake_case (lowercase with underscores)
- Avoid spaces and special characters
- Keep names concise but descriptive
- Document your conventions:
- Create a central reference document
- Include examples and explanations
- Share with all team members
Example naming convention for an ecommerce site:
Tip 4: Leverage Enhanced Measurement Settings
GA4's Enhanced Measurement automatically tracks common interactions without additional code.
Available automatic tracking:
- Page views
- Scrolls
- Outbound clicks
- Site search
- Video engagement
- File downloads
How to optimize:
- Enable/disable specific measurements:
- Go to Admin > Data Streams > Your Web Stream
- Click "Enhanced Measurement" toggle
- Click the gear icon to customize individual events
- Customize thresholds:
- Adjust scroll depth percentage (default: 90%)
- Set minimum video engagement time
- Mark relevant automatic events as conversions:
- For example, file_download for key resources
- scroll for content engagement metrics
Tip 5: Implement Regular Data Quality Checks
Ongoing monitoring ensures your conversion data remains accurate over time.
Create a monitoring system:
- Schedule weekly data reviews:
- Compare conversion volumes to historical trends
- Look for unexpected spikes or drops
- Cross-check with backend systems
- Set up automated alerts:
- Create custom GA4 Explorations for anomaly detection
- Set up BigQuery exports for advanced monitoring
- Use third-party tools for automated alerts
- Compare GA4 data with other sources:
- CRM submissions vs. form conversion events
- Ecommerce platform orders vs. purchase events
- Email signups vs. newsletter conversion events
Example data quality dashboard: Create a GA4 Exploration that shows:
- Daily conversion counts by type
- Conversion rate trends
- Top conversion paths
- Device breakdown of conversions
P.S. heatmapAI provides real-time conversion tracking with automatic anomaly detection, alerting you to issues immediately—not 24 hours later like GA4. This ensures you can fix conversion problems before they significantly impact your business.

Tip 6: Utilize Custom Dimensions for Deeper Insights
Custom dimensions add valuable context to your conversion data.
How to implement:
- Create custom dimensions:
- Go to Admin > Custom Definitions > Custom Dimensions
- Click "Create custom dimension"
- Enter name, description, and scope (user, session, or event)
- Collect dimension values:
- Add parameters to your events
- Use GTM variables to populate values
- Ensure consistent formatting
- Use in analysis:
- Create segments based on custom dimensions
- Compare conversion rates across dimension values
- Identify high-performing segments
Valuable custom dimensions for conversion analysis:
Tip 7: Set Up Conversion Funnels for Journey Analysis
Funnels provide critical context for understanding the paths to conversion.
Creating conversion funnels in GA4 Explorations:
- Go to Explore > Create New Exploration
- Choose the Funnel exploration technique
- Configure your funnel steps:
- Add each event in your conversion path
- Set step order and requirements
- Add segment comparisons if needed
- Analyze drop-off points:
- Identify stages with highest abandonment
- Compare funnel performance across segments
- Test improvements to problematic steps
Example ecommerce funnel:
- view_product
- add_to_cart
- begin_checkout
- add_shipping_info
- add_payment_info
- purchase
Analyzing Conversion Data in GA4
Once you've set up accurate conversion tracking, you need to extract actionable insights from the data.
Key Reports for Conversion Analysis
GA4 offers several built-in reports for analyzing conversion performance:
- Conversions report:
- Path: Reports > Engagement > Conversions
- Shows: Overall conversion counts and trends
- Use for: Monitoring conversion volume and identifying patterns
- Events report:
- Path: Reports > Engagement > Events
- Shows: All events, including conversions
- Use for: Comparing conversion events to other interactions
- User acquisition report:
- Path: Reports > Acquisition > User acquisition
- Shows: How users who convert were acquired
- Use for: Identifying top-performing channels
- Exploration techniques for conversion data:
- Funnel analysis: Visualize conversion paths
- Segment overlap: Find relationships between user groups
- Path exploration: Discover common journeys to conversion
Creating a conversion performance dashboard:
- Go to Customization > Dashboards > Create
- Add cards for key conversion metrics:
- Conversion counts by type
- Conversion rates by channel
- Conversion value by device
- User segments with highest conversion rates
Understanding Attribution Models in GA4
Attribution determines which touchpoints receive credit for conversions.
Available attribution models in GA4:
- Data-driven attribution (default): Uses machine learning to distribute credit based on impact
- Last click: Gives 100% credit to the final touchpoint
- First click: Gives 100% credit to the initial touchpoint
- Linear: Distributes credit equally across all touchpoints
- Position-based: Gives 40% to first and last touchpoints, 20% to middle touchpoints
- Time decay: Gives more credit to touchpoints closer to conversion
How to compare attribution models:
- Go to Advertising > Attribution > Model comparison
- Select models to compare
- Analyze differences in channel performance
- Identify undervalued channels in last-click attribution
Choosing the right model for your business:
Creating Custom Reports for Conversion Insights
Standard reports often don't provide the specific insights you need.
Building effective GA4 Explorations:
- Choose the right technique:
- Free form for flexible analysis
- Funnel for conversion path analysis
- Path for journey visualization
- Segment overlap for audience insights
- Select dimensions and metrics:
- Conversion events as metrics
- Acquisition source, device, etc. as dimensions
- Custom dimensions for deeper segmentation
- Apply segments for comparison:
- Converters vs. non-converters
- New vs. returning users
- Different traffic sources
Example custom conversion report:
- Exploration type: Free form
- Dimensions: Source, medium, campaign
- Metrics: Key events, key event rate, average engagement time
- Segments: Converted users, non-converted users
- Visualization: Table with conditional formatting
Setting up automated reports:
- Schedule email delivery:
- In Explorations, click "Share" > "Schedule email"
- Set frequency and recipients
- Add contextual notes
- Export to Google Sheets for team dashboards:
- Click "Export" > "Google Sheets"
- Set up automated refreshes
- Add visualizations and commentary
Limitations of GA4 Conversion Tracking
Despite its advantages, GA4 conversion tracking has several important limitations to be aware of:
Character Limits for Event Names
Retroactive Data Limitations
Sampling Issues with High-Traffic Sites
Manual Setup Requirements
Unlike GA4, which requires manual setup and ongoing maintenance that can lead to missed data and configuration errors, heatmap automatically tracks all revenue-driving actions without any manual effort. This delivers complete and accurate conversion data without the technical overhead, letting you focus on insights and growth instead of complex configurations.
Beyond GA4: Simplifying Conversion Tracking with heatmapAI
While GA4 offers powerful capabilities, its complex setup requirements and limitations have led many businesses to seek alternatives that provide simpler, more accurate conversion insights.
Automatic Conversion Tracking Without Manual Setup
Every conversion event requires manual configuration, custom coding, and ongoing maintenance. This process typically takes 20-40 hours of developer time (approximately $3,000-5,000 in costs).
heatmapAI automatically tracks all revenue-driving actions on your site without any manual configuration. Simply install the tracking code once, and heatmap identifies and monitors every meaningful interaction.
Key benefits:
- Zero custom code required
- No event parameter configuration
- Complete data collection from day one
- No risk of missing critical conversion events
Revenue-Based Insights That Connect Behavior to Sales
GA4 tracks events in isolation, making it difficult to connect user behavior to actual revenue outcomes. It also inflates ecommerce data by tracking gross revenue without accounting for discounts.
heatmap, on the other hand, ties every interaction directly to revenue, showing exactly how much value each element on your site generates. This revenue-attributed data reveals which buttons, images, and content truly drive business results.

For example, Obvi used heatmap's revenue insights to identify that their primary CTA button was positioned below the average mobile fold height. After repositioning it, they saw a 7.8% increase in revenue per session—translating to $2.5 million in additional annual revenue.

Real-Time Data vs. GA4's 24-Hour Delay
GA4 has a processing delay of 24-48 hours for standard reports, making it impossible to identify and address conversion issues quickly.
heatmapAI delivers real-time key metrics—like revenue per session, scroll depth, high-traffic pages, and engaged sessions—through an intuitive dashboard. This enables you to monitor conversion performance at a glance, allowing fast issue detection and resolution without the wait and complexity of GA4’s delayed reports.
AI-Powered Recommendations for Improving Conversions
GA4 provides data but offers limited actionable guidance on how to improve conversion rates.
heatmapAI, on the other hand, offers over 500 AI-driven recommendations to enhance copy, rearrange page elements, improve visuals, and optimize other on-page elements— all designed to boost revenue per session.

These actionable insights focus on key pages like the mobile homepage, collection pages, and product display pages (PDP), empowering businesses to increase profitability efficiently without guesswork.
For instance, Cooking Guild, a premium kitchen knives brand, leveraged heatmapAI to increase revenue per session. heatmap's CRO engine revealed that the highest-priced products on their collection pages weren’t generating the highest profitability and recommended re-arranging the product display.

Acting on this data-driven recommendation, Cooking Guild saw a 48% increase in revenue per session and a 40x return on investment within 30 days—showcasing the power of actionable AI insights to drive ecommerce growth.

Still Struggling with GA4 Conversion Tracking? Try heatmap Instead
Setting up effective conversion tracking in Google Analytics requires careful planning, precise implementation, and ongoing maintenance. While you can overcome GA4's limitations by following the best practices in this guide, the process remains time-consuming and error-prone.
For many businesses, the ideal approach combines GA4's analytical depth with Heatmap's simplicity and accuracy. Heatmap automatically tracks all revenue-driving actions without configuration, providing real-time insights that show exactly which elements generate the most value—no manual setup required.
Whether you choose to optimize your GA4 setup or explore alternatives like heatmap, the most important thing is building a foundation of reliable conversion data that drives better business decisions and measurable growth.
Frequently Asked Questions
How many conversion events can I track in GA4?
GA4 allows you to mark up to 30 events as conversions (key events) per property. This limit applies to both automatically collected and custom events. If you need to track more than 30 conversion types, consider grouping similar conversions under a single event with distinguishing parameters.
Can I import goals from Universal Analytics to GA4?
No, there is no direct way to import goals from Universal Analytics to GA4. Due to the fundamental differences between UA's goal-based system and GA4's event-based approach, you'll need to recreate your conversion tracking setup in GA4 manually. This transition offers an opportunity to reassess which conversions truly matter to your business.
How long does it take for conversion data to appear in GA4?
Standard GA4 reports typically have a 24-48 hour processing delay before conversion data appears. However, you can use the Real-Time report to verify that conversion events are being collected immediately. For critical conversion monitoring, consider using tools like heatmapAI that provide real-time conversion data without delays.
Can GA4 track offline conversions?
Yes, GA4 can track offline conversions through several methods:
- Measurement Protocol: Send server-side events for offline actions
- User ID: Connect online and offline interactions with a consistent ID
- Google Ads Conversion Tracking: Import offline conversion data via Google Ads
- BigQuery integration: Join GA4 data with offline conversion data in BigQuery
The most effective approach depends on your specific business needs and technical resources.
How accurate is GA4's conversion tracking compared to other tools?
GA4's conversion tracking accuracy varies based on implementation quality and several inherent limitations:
- Client-side tracking: Vulnerable to ad blockers and privacy tools
- Sampling: May affect data accuracy for high-traffic sites
- Attribution differences: Models may differ from other platforms
- Cookie limitations: Restricted by browser privacy settings
For business-critical conversion data, many organizations supplement GA4 with server-side tracking or specialized tools like heatmapAI that offer alternative tracking methods.
Try heatmap.com | Your eCommerce site will thank you (so will your wallet)
We are the only onsite analytics platform that tells you how to make more money - down to the pixel. Trusted by 1000+ eCommerce brands.

Ashvin Melwani
@ashvinmelwaniWith heatmap, I've been able to figure out what elements actually increase AOV and optimize our landing pages to drive more first purchase profitability, we're up 23% YoY.

How You Can Do It:
1: Download heatmap
2: Wait for 5k sessions
3: Reorganize products based on the highest revenue per session from top left to bottom right.

Founder of heatmap, SplitTesting.com, and multiple ecommerce brands. Lifelong optimizer, CRO-lover, and data nerd.


You made it all the way down here?
Might as well give us a shot, right? It'll change the way you approach CRO. We promise. In fact, our friend Nate over at Original Grain used element-level revenue data from heatmap to identify high-impact areas of his website to test, resulting in a 17% lift in Revenue per Session while scaling site traffic by 43%. Be like Nate. Try heatmap today.
