AI insights that show
revenue leaks, and
what it’s costing you.
Heatmap watches your store, works out what's costing you money, and tells you in plain language what to fix first.


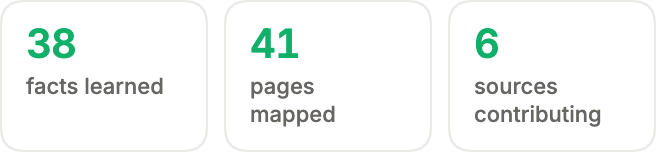




Revenue found by agencies and brands using Heatmap.
Built on billions of real customer interactions.
We don't guess what your visitors are doing. We analyze it.
Clicks don’t pay the bills.
Revenue does.
Every element on every page carries a number: what it earned, not how many times it was touched. Scrollmaps show how far people actually get, and what the ones who never scroll are costing you.

Revenue per element
Revenue scrollmaps
Every session, no sampling
Pages don’t convert. Journeys do.
Follow the real path from first landing to checkout: what your best customers open, what they skip, and where everybody else quietly loses momentum in the gap between two pages.
The paths that end in a purchase
The transitions where intent dies
The routes you never designed
The numbers our customers see once heatmap is watching their store.
The numbers, without the dashboard tax.
Revenue per session by page, product and traffic source, live. No data layer, no tagging plan, no analyst to book. Install it and the numbers are there.
Revenue per session, not conversion rate
Segment it yourself
Real time
See where the money walks out.
Build a funnel in minutes, then watch intent turn into nothing. Every drop-off carries the revenue that left with it, so the list of what to fix sorts itself.
Built in minutes
Priced drop-offs
Split by segment
The brands that trust heatmap to tell them what to fix first.







"I've been looking for a GA4 replacement ever since it dropped, and finally heatmap's new Web Analytics platform has blown me away. Setup takes just seconds, the data's more accurate, and I'm able to pull actionable insights easily. Plus, the flat-fee pricing has made it super easy to scale across all my agency's ecommerce clients. 10/10 recommend!"

Marketing Max, Founder
Stop guessing. Ask them.
Behavior shows you where people hesitate. It cannot tell you why. Put the question on that page and read the answers back as themes, not a spreadsheet.
- Live in five minutes
- On any page, or at the step where people stall.
- Themes, not transcripts
- Open answers summarized into what people keep saying, with the mood attached.
- Who saw it, who bailed
- Its own drop-off too, so you know what the silence meant.
Stop watching random sessions.
Every recording carries what the session was worth and how close it came, so you watch the ones that matter: the buyers, and the near-misses that look exactly like them right up until they don’t.
- Sorted by revenue and intent
- Not by whichever session happened to be the most recent.
- Jump to the moment
- Add to cart, checkout error, rage click. The timeline is indexed.
- Share a session with a link
- No login on the other end, for the client or the developer.
Ship the version that made money.
Test a page, then read the result the way the rest of heatmap reads everything: revenue per session, by variant, with the significance called for you. Conversion rate is there too. It is not the number that decides.
- Revenue per session, per variant
- A variant can convert more and earn less. You see both, so the winner is the one that paid.
- Significance, called for you
- The test says when it is done. No calculator, and no argument about sample size.
- A heatmap for each variant
- Not just which version won, but what people did differently inside it.
Clicks are the last 5%.
See the rest.
Reading, comparing, hovering, hesitating: most of a decision happens with nothing clicked. The Attention Map cuts every page into 20 bands and measures, for each one, how many people got there and how many actually took it in.
- Reach and attention, per band
- How many visitors got this far, and of those, how many had it in view long enough to read it.
- Hesitancy on every element
- How long the cursor sat on a button before the click. Fifteen seconds on a CTA is an objection, not a layout problem.
- Predicted against measured
- What the design invites people to look at, beside what they actually did.
"I've been able to figure out what elements actually increase AOV and optimize our landing pages to drive more first purchase profitability, we're up 23% YoY."

Ashvin Melwani, CMO & Co-Founder
Read any page without leaving it.
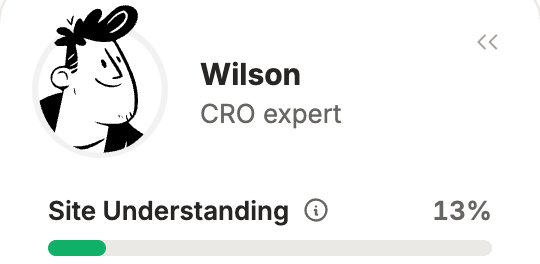
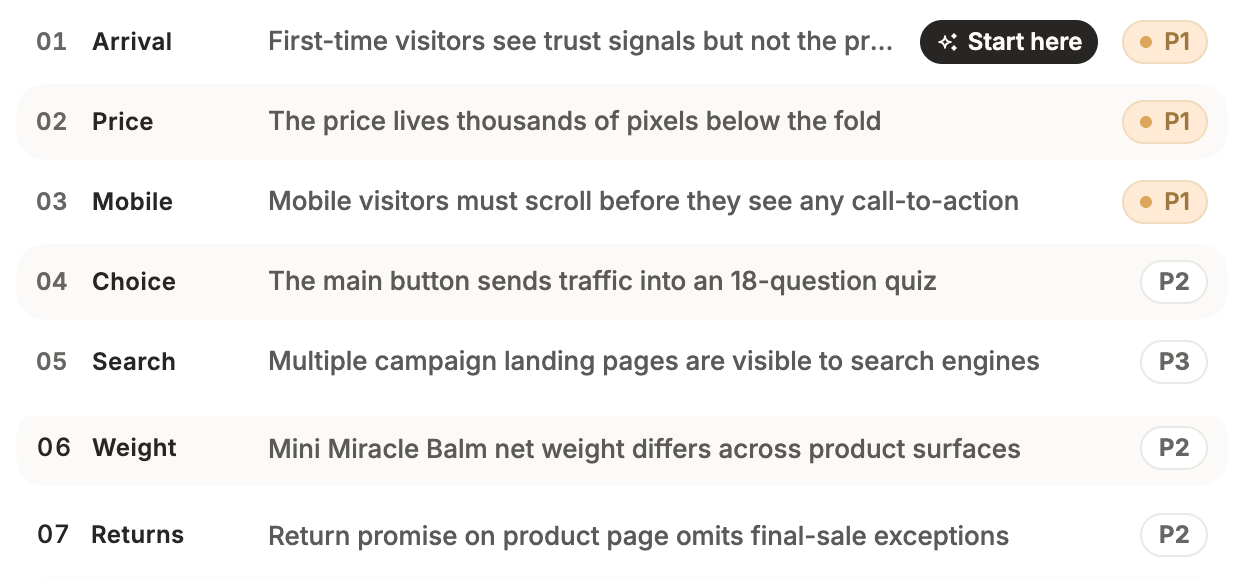
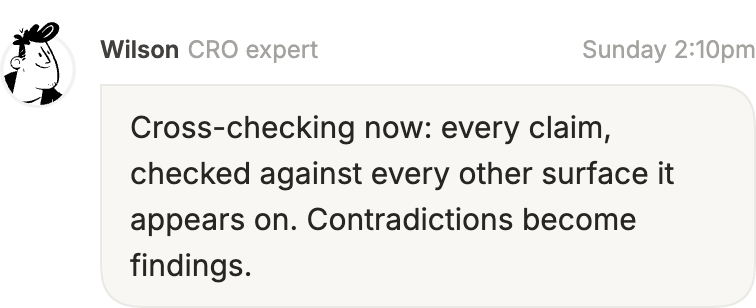
The heatmap extension opens a side panel on any store page and reads it right there. On your own site, that is your heatmaps, funnels, recordings and surveys beside the page they describe. On any other, Wilson scans the page and lists what to fix first.
- A free scan on any site
- Open the panel on a page and get a prioritized list of what to fix. No account, no code.
- Your data, beside the page
- Heatmaps, funnels, recordings and surveys for the page you are looking at, for subscribers.
- The finding, pointed at
- Each recommendation highlights the element it is about, on the page itself.
Stop reading
dashboards.
Ask your store
what happened.
Connect heatmap to Claude, ChatGPT, Cursor or Codex and ask why checkout revenue dropped last week, in plain English.
Walk into the client call
already knowing
their store.
Install once, bring the fix list to the first meeting, and report in the number the client actually cares about.