The Ultimate CRO Audit Checklist For Immediate Conversion Lifts


Master the essentials of a CRO audit to enhance your website's performance. Discover practical strategies for boosting conversions. Read the article now!

Conversion bottlenecks are costing you money right now. While your competitors fine-tune their websites for maximum returns, small friction points on your site silently drain revenue with every visitor who fails to convert.
This guide shares how to:
- Identify exactly where and why users abandon your conversion funnel using revenue-based analytics
- Turn technical insights into actionable optimizations that boost conversions within days, not months
- Prioritize CRO changes based on actual revenue impact rather than guesswork or vanity metrics
TL;DR
- Define clear conversion goals - Identify both macro conversions (purchases, subscriptions) and micro conversions (add-to-carts, email signups) with specific KPIs for each
- Analyze user behavior with revenue focus - Use heatmaps and session recordings to see where high-value users engage vs. where they drop off
- Audit technical performance - Ensure page load times under 2 seconds, optimize for mobile (buttons should be 44×44px minimum), and fix JavaScript errors causing conversion blocks
- Evaluate content and design - Test CTA button colors that contrast with your site's color scheme, position primary CTAs above the fold, and include trust signals near conversion points
- Segment user journeys -Segment user journeys by analyzing the behavior of high-value versus low-value customers, identifying key factors that differentiate your top converters.
- Create a prioritized roadmap - Use the ICE framework (Impact, Confidence, Ease) to prioritize changes with the highest potential revenue impact
Key Benefits of Conducting a CRO Audit
A proper conversion rate optimization audit isn't just another marketing task—it's a strategic investment that delivers measurable returns. Here's why investing time in a CRO audit pays dividends:
Increase Conversion Rates by Pinpointing Where Users Drop Off
The most obvious benefit is turning more visitors into customers. By systematically identifying and removing conversion barriers, you can see significant improvements in your conversion rate.
A comprehensive CRO audit helps you pinpoint exactly where users drop off in your conversion funnel, whether it's:
- Confusing navigation paths
- Unclear value propositions
- Complicated checkout processes
- Slow-loading pages
- Ineffective calls-to-action
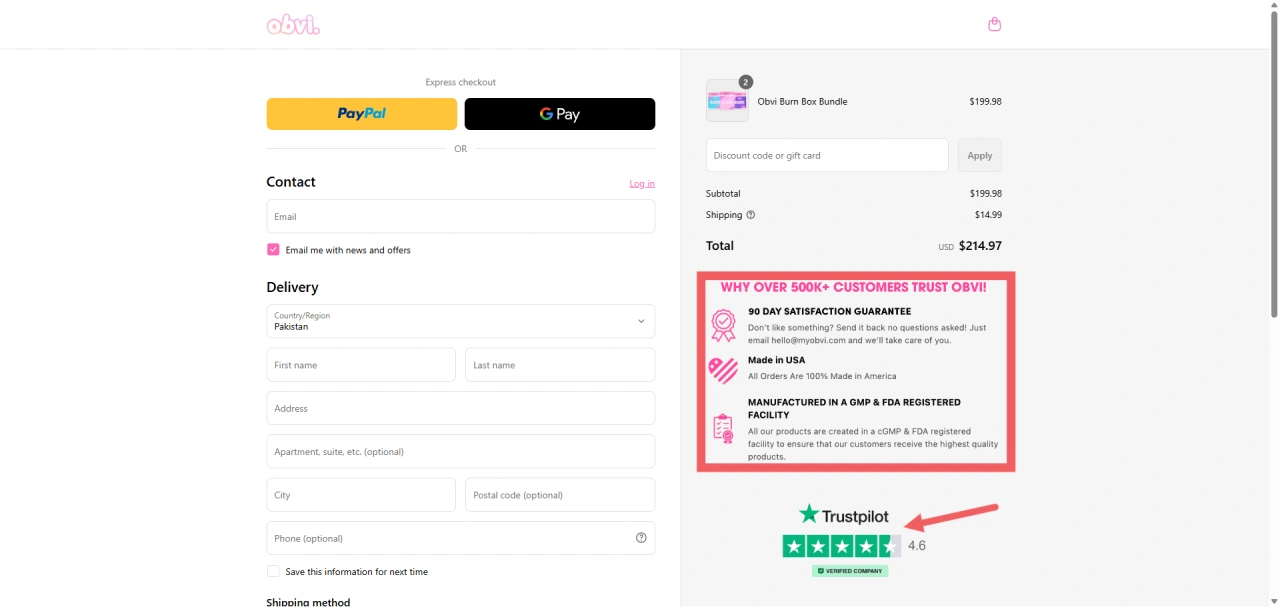
By identifying and removing conversion barriers, a CRO audit can significantly improve your conversion rate. For example, Obvi increased their Revenue Per Session by 7.8% after implementing insights from heatmapAI’s CRO engine. One key recommendation was repositioning their CTA button, which led to a 100x ROI in just one month, adding $2.5 million in revenue.

Maximize ROI on Marketing Spend by Converting More Existing Visitors
Why spend more on traffic acquisition when you can get better results from your existing visitors?
Consider this: If you're currently spending $10,000 per month on ads with a 2% conversion rate, improving that rate to just 3% is equivalent to increasing your ad budget by $5,000.
A CRO audit helps you maximize the value of every visitor by:
- Optimizing landing pages to better match ad messaging
- Improving user experience to increase engagement
- Reducing friction in the conversion process
- Identifying your highest-converting traffic sources
This approach transforms your marketing from a volume game to a conversion-focused strategy.
Enhance User Experience by Removing Friction Points
User experience and conversion rates are intrinsically linked. When visitors can easily navigate your site, find what they need, and complete desired actions without frustration, they're more likely to convert.
A thorough CRO audit examines the entire user journey, identifying:
- Navigation bottlenecks
- Mobile responsiveness issues
- Form field friction
- Page load speed problems
- Content relevance and clarity
By addressing these issues, you create a smoother path to conversion while simultaneously improving overall user satisfaction.
Make Data-Driven Decisions by Analyzing User Behavior Insights
One of the most valuable aspects of a CRO audit is replacing guesswork with actual user behavior insights.
Instead of making design and content decisions based on opinions or assumptions, a CRO audit provides concrete data on:
- Which page elements users actually engage with
- Where users spend the most time
- Which content drives conversions
- What causes users to abandon their journey
- Which segments of your audience behave differently
This data-driven approach ensures that your optimization efforts target real problems rather than perceived issues.
Gain a Competitive Advantage by Leveraging User Behavior Data
While many businesses rely on outdated practices or generic "best practices," a proper CRO audit gives you specific insights into your unique audience and their behavior.
This tailored approach provides a significant competitive advantage by:
- Identifying opportunities your competitors might miss
- Creating experiences specifically designed for your audience
- Optimizing based on your actual user data, not industry averages
- Continually improving while competitors remain static
By implementing revenue-focused analytics, you can see not just where users click, but which interactions actually drive revenue—a critical difference that most traditional analytics tools miss.
The 7-Step CRO Audit Methodology
A systematic approach to CRO auditing ensures you capture all potential conversion opportunities. Let's break down the process into actionable steps.
Step 1: Define Your Conversion Goals and KPIs
Before diving into analysis, clearly define what "conversion" means for your business. This could be purchases, lead form submissions, free trial signups, or newsletter subscriptions.
Start by categorizing your conversions:
- Macro conversions: Primary business goals (purchases, subscriptions)
- Micro conversions: Smaller steps toward macro conversions (email signups, add-to-carts)
For each conversion type, establish specific KPIs to measure success:
Step 2: Analyze User Behavior Data
Once your goals are defined, gather comprehensive user behavior data to understand how visitors interact with your site.
Essential user behavior tools include:
- Heatmaps: Visualize where users click, move, and scroll on your pages
- Session Recordings: Watch real user interactions to identify confusion points
- Funnel Analysis: Track where users drop off in your conversion process
- Form Analytics: Identify problematic fields causing abandonment
When analyzing user behavior data, pay special attention to:
- Click distribution: Are users clicking on non-clickable elements or missing important CTAs?
- Scroll depth: Do users see your key conversion elements or abandon before reaching them?
- Session duration: How long do users spend on key pages before converting or leaving?
- Navigation paths: What routes do users take through your site before converting?
heatmapAI's revenue-focused analytics can show you not just where users click, but which interactions actually drive revenue. This helps distinguish between high-engagement and high-value page elements—a critical difference that most traditional analytics tools miss.
For instance, Cooking Guild, an e-commerce brand selling high-end kitchen knives, was struggling with low conversions on their collection pages, despite significant traffic. heatmap’s data showed that the highest-priced products weren’t giving the highest profitability.

The CRO engine recommended re-organizing the product placement, which resulted in a 48% increase in Revenue Per Session and over 40x ROI within just 30 days.

Step 3: Evaluate Technical Performance
Technical issues can severely impact conversion rates by creating friction in the user experience. A thorough technical evaluation should include:
Page Load Speed
Slow-loading pages are conversion killers. According to Google, as page load time increases from 1 to 3 seconds, the probability of bounce increases by 32%.
BTW, heatmapAI includes built-in site speed tracking, identifying slowdowns, and offering recommendations. This helps you stay on top of performance issues that could be costing you revenue.

Mobile Responsiveness
With mobile traffic accounting for approximately 60% of web traffic, mobile optimization is critical.
Mobile optimization checklist:
- Tap targets: Ensure buttons and links are at least 44×44 pixels.
- Font size: The body text should be at least 16px. This ensures readability on small screens without requiring users to zoom in.
- Viewport configuration: Set up the viewport correctly with the meta viewport tag:
<meta name="viewport" content="width=device-width, initial-scale=1.0">. This ensures that the website adjusts to the device's screen width and provides a better user experience on mobile and tablet devices. - Input fields: Ensure input fields are large enough for easy interaction on mobile devices. The width should be around 80-90% of the screen size, and the height should be at least 44px for comfortable tapping. Provide at least 10px of padding on all sides to prevent text from being too close to the edges.
- Navigation: Simplify navigation for smaller screens. Use collapsible menus, sticky navigation bars, or hamburger menus to reduce clutter and make navigation intuitive. Make sure that users can easily access important sections with minimal scrolling or tapping.
Action step: Test your site across multiple devices and screen sizes using tools like BrowserStack or the Chrome DevTools device emulator.
Browser Compatibility
Ensure your site functions properly across all major browsers.
Browser testing checklist:
- Test on Chrome, Safari, Firefox, and Edge
- Check both desktop and mobile versions
- Verify functionality of all interactive elements
- Ensure forms work correctly across browsers
Action step: Use cross-browser testing tools like CrossBrowserTesting or LambdaTest to identify browser-specific issues.
JavaScript Errors
JavaScript errors can prevent critical site functionality from working properly.
JavaScript error tracking:
- Implement error logging to catch client-side errors
- Monitor console errors through tools like Sentry or Heatmap's error tracking
- Prioritize fixing errors that occur on high-value pages
heatmapAI also offers JavaScript error tracking, helping you find and fix technical bugs that might impact site function or user trust before they cause major issues.

Step 4: Conduct Content and Design Analysis
How your content and design elements support or hinder conversions is crucial to understand. This analysis should examine:
Value Proposition Clarity
Your unique value proposition should be immediately clear to visitors.
Value proposition checklist:
- Visible within the first 5 seconds of page load: Place your UVP in a prominent position at the top of the page or above the fold. The UVP should be the first thing users encounter when they land on the page, so avoid clutter in this area.
- Clearly communicates the primary benefit to users: Use direct, benefit-oriented language. For example, instead of saying “We offer project management tools,” say “Complete your projects 30% faster with our simple tools.”
- Differentiates from competitors: Focus on what makes your offer unique. Research competitors and find a clear differentiator. Is your product faster, more affordable, or more user-friendly? Highlight that feature clearly in your UVP.
- Addresses the user's main pain point: Be specific about the user's problem and show how your solution is the best fix. For example, if users struggle with time tracking, your UVP could say, “Track your work hours automatically with one click,” directly addressing the pain of manual time logging.
Action step: Test your value proposition with the "5-second test"—show users your page for 5 seconds, then ask what they remember about what your product or service offers.
Call-to-Action Effectiveness

CTAs are the gateways to conversion and deserve special attention.
CTA optimization checklist:
- Visibility: Use contrasting colors (e.g., bright buttons on a neutral background) for better visibility and accessibility.
- Size: Ensure CTAs are at least 44×44px on mobile for easy tapping, especially in the thumbs zone.
- Copy: Use action-driven language like “Get Started Now” or “Claim Your Offer,” with urgency or value.
- Placement: Position CTAs above the fold (e.g., in the header), after benefit sections, and at the bottom of the page for users ready to take action.
Action step: Use heatmaps to identify your current CTA click rates, then A/B test variations in color, size, copy, and placement.
Content Relevance
Your content should directly address user needs and pain points.
Content relevance checklist:
- Headlines Clearly Communicate the Main Benefit: Use benefit-driven language to immediately highlight the key advantage of your product. Focus on what users will gain from it. For example, instead of saying "Noise-Canceling Headphones," say "Enjoy Superior Sound Quality with Noise-Canceling Headphones."
- Body Copy Expands on the Value Proposition: Explain how it solves a user’s problem or improves their experience. For example, say "Designed to block out external noise, these headphones let you immerse yourself in clear, uninterrupted audio—whether you’re working, traveling, or relaxing."
- Content Answers Common User Questions: Content Answers Common User Questions: Think about the common questions users may have. If you're selling headphones, these could be about battery life, compatibility, and comfort. Make sure your copy answers these. For example, "Enjoy up to 20 hours of battery life on a single charge."
- Language Matches Your Target Audience's Terminology: Avoid overcomplicating terms for general consumers, but feel free to use technical terms for enthusiasts. For example, for a general audience, say "long-lasting battery life" and "comfortable to wear all day." For audiophiles, use terms like "high-fidelity sound" and "active noise cancellation."
But how can you learn if your content is actually being read? heatmapAI's interactive scrollmaps show how far down the page users scroll, highlighting where attention drops off. Pair this with revenue heatmaps to see which content sections users engage with before converting.

Visual Hierarchy
The visual hierarchy of your page should guide users naturally toward conversion actions.
Visual hierarchy checklist:
- Most important elements (like CTAs) stand out visually: Ensure CTAs like "Buy Now" or "Sign Up" are larger than the rest of the text and stand out in color (e.g., bright blue or orange) against a neutral background. Avoid using too many competing colors around CTAs to maintain focus.
- Related information is visually grouped together: For example, on an e-commerce product page, group the product image, price, and "Add to Cart" button within a clearly defined section.
- White space is used effectively to separate different sections: Leave 30-40px between the headline, body text, and CTA button. Add 20-30px padding between product features and maintain at least 40px margin around images to avoid overwhelming the content.
- Typography Hierarchy Makes Content Easily Scannable: Establish a clear hierarchy using different font sizes. Use 24-32px for main headings, 18-24px for subheadings, and 14-16px for body text. Make headings bold to draw attention, break long paragraphs into smaller chunks, and add bullet points to make the content skimmable.
- Visual flow leads the eye toward conversion elements: Use contrasting colors, bold text, and strategic placement to draw attention to the CTA. For example, place a large, vibrant "Buy Now" button right beneath the product description, with supporting text like "Limited Time Offer" to create urgency and encourage action.
Action step: Conduct a squint test—look at your page while squinting to see which elements stand out. If your CTA isn't immediately visible, rework your visual hierarchy.
Trust Signals

Trust signals reassure visitors that your site is legitimate and their information is safe.
Trust signals to include:
- Customer Testimonials and Reviews: Display reviews on product pages and on the checkout page, where customers are most likely to second-guess their purchase.
- Security Badges and Certifications: Feature security badges prominently on the checkout and payment pages, ensuring customers know their payment information is secure.
- Money-Back Guarantees: Highlight the money-back guarantee in the product description and again in the checkout process, giving customers peace of mind before they commit.
- Privacy Policy and Terms of Service: Include links to your privacy policy and terms of service in the footer.
- Contact Information and Physical Address: Make your contact information and physical address visible in the footer and on the "Contact Us" page to enhance credibility.
- Social Proof (Customer Counts, Social Media Followers): Display on the landing page and near the CTA on product pages to showcase your brand’s popularity and trustworthiness.
Action step: Add relevant trust signals near conversion points, especially on checkout pages or lead forms.
Step 5: Analyze User Segments and Journeys
Different user segments often behave differently. Segment your analysis by:
- Traffic source (organic, paid, social, direct)
- Device type (desktop, mobile, tablet)
- New vs. returning visitors
- Geographic location
- Customer journey stage
User segmentation analysis checklist:
- Compare conversion rates across different segments
- Identify segments with unusually high or low conversion rates
- Analyze behavior patterns unique to each segment
- Create segment-specific optimization strategies
This is where heatmapAI's session recordings shine. Watch anonymized recordings to see exactly:
- Where users click and engage.
- How far they scroll down a page.
- Points where they hesitate or seem confused.
- Where they get stuck or drop off.

Plus, the Comparison Mode allows you to compare different cohorts like new vs. returning visitors or high vs. low-value customers. This helps you pinpoint which user segments are facing specific issues and optimize their experience accordingly.
For instance, That Works Agency used heatmapAI's session recordings to uncover a major friction in their conversion path. They found that many users were abandoning their searches because the filter to sort products was hard to find. By making the filter more accessible, they saw:
- +4.22% increase in conversion rate
- +13.07% increase in revenue per session
- +14.19% increase in average basket size

Step 6: Gather Qualitative Insights
Supplement your quantitative data with qualitative feedback to understand the "why" behind user behavior.
Qualitative research methods:
- heatmapAI's surveys: Gain feedback to understand users' experience and conversion barriers
- Customer Interviews: Get deeper insights from actual customers
- User Testing: Observe real users attempting to complete key tasks
- Feedback Tools: Implement on-site feedback mechanisms
When analyzing qualitative data, pay special attention to:
- Rage clicks: Repeated rapid clicks in the same area often indicate user frustration with non-responsive elements or confusing interfaces
P.S. heatmapAI tracks rage clicks to pinpoint where users are frustrated, allowing you to quickly address navigation issues and improve the overall user experience.

- Hesitation points: Areas where users pause for extended periods, suggesting confusion
- Common complaints: Recurring themes in feedback that point to systemic issues
- Feature requests: User suggestions that could improve the conversion process
Example question set for exit-intent surveys:
- "What prevented you from completing your purchase today?"
- "Was there anything confusing about our checkout process?"
- "What would have made you more likely to complete your purchase?"
- "Is there anything else you'd like to tell us about your experience?"
heatmapAI's survey feature allows you to collect this qualitative behavior data with zero setup required. You can create and share survey links instantly via email, social media, or any digital channel where your customers interact with your brand—no developer work needed.
What sets heatmapAI's survey tool apart is its built-in AI analysis capabilities:
- Dropoff & Impression Analysis: See exactly where users saw questions and where they abandoned the survey
- AI Summaries: Automatically identify top themes from responses without manual spreadsheet analysis
- Sentiment Scoring: Instantly detect frustration, confusion, or delight in open-ended answers

Step 7: Develop and Prioritize Recommendations
Based on all collected data, develop a prioritized list of recommendations:
Impact vs. Effort Matrix
Not all optimizations are created equal. Use an Impact vs. Effort matrix to prioritize changes:
Revenue Potential
Focus on changes with the highest revenue impact by calculating the potential value of each optimization:
Revenue impact formula:

For example, if you have 10,000 monthly visitors, a 0.5% conversion rate increase, and an average order value of $100:
Implementation Timeline
Create a structured implementation plan that includes:
- Quick Wins: Immediate, high-impact changes (1-2 weeks)
- Medium-Term Projects: More complex optimizations (1-3 months)
- Long-Term Initiatives: Major redesigns or structural changes (3+ months)
Testing Plan
Outline A/B tests to validate major changes:
- Create a clear hypothesis based on audit findings
- Design test variations that address specific issues
- Run tests with sufficient traffic to achieve statistical significance
- Analyze results based on conversion impact and revenue, not just engagement
With heatmapAI's revenue-based heatmaps, you can see exactly how every click on your site impacts your revenue, giving you clear insights into which elements are driving sales.
You can even filter the data by user behavior, average order value, traffic source, and more, making it easy to understand what’s working and what needs improvement.

And, with heatmapAI's CRO Engine offering over 500 recommendations, you can prioritize the most impactful changes, focusing on the ones that will boost your revenue and improve overall performance.

Essential Tools for an Effective CRO Audit
To conduct a thorough CRO audit, you'll need these key tools:
Analytics and Heatmapping Tools
- Google Analytics: For baseline traffic and conversion data
- heatmapAI: For revenue-based heatmaps, scrollmaps, and session recordings
heatmap stands out by tying revenue data directly to user interactions, allowing you to see not just what users do, but how those actions impact your bottom line—a feature missing from tools like GA4, Hotjar, and Microsoft Clarity.
Technical Analysis Tools
- Google PageSpeed Insights: For comprehensive performance analysis and Core Web Vitals assessment
- GTmetrix: For detailed page speed analysis with actionable recommendations
- BrowserStack: To test your site across 2,000+ real browsers and devices
- LambdaTest: For cross-browser compatibility testing with automated visual regression
- heatmapAI: For JavaScript error detection and site speed monitoring
User Research and Feedback Tools
- Typeform: For designing engaging, conversational surveys with high completion rates
- heatmapAI Surveys: For capturing customer feedback with AI-powered analysis that automatically identifies themes and sentiment in responses
A/B Testing and Experimentation Tools
- Optimizely: Enterprise-level experimentation platform
- VWO (Visual Website Optimizer): Comprehensive testing suite with visual editor
- heatmapAI: While heatmapAI doesn’t run A/B tests directly, it seamlessly integrates with top A/B testing tools like Intelligems, Visually, Convert, and Shoplift, allowing brands to supercharge their split-testing strategies.
How to Implement and Measure CRO Audit Results
Turning your CRO audit insights into measurable results requires a systematic approach.
Creating an Implementation Roadmap
Develop a structured implementation plan that includes:
A/B Testing Methodology
For significant changes, implement A/B testing to validate effectiveness:
- Create a clear hypothesis based on audit findings: "If we simplify our checkout form by reducing fields from 12 to 6, then our checkout completion rate will increase by 15% because users will experience less friction."
- Design test variations that address specific issues:
- Control (A): Current checkout form with 12 fields
- Variation (B): Simplified checkout form with 6 essential fields
- Run tests with sufficient traffic to achieve statistical significance:
- Determine required sample size based on your current conversion rate and the minimum detectable effect
- Use a sample size calculator to ensure reliable results
- Run tests for at least 2 weeks to account for day-of-week variations
- Analyze results based on conversion impact and revenue, not just engagement:
- Primary metric: Checkout completion rate
- Secondary metrics: Revenue per user, average order value
- Segment analysis: How different user groups responded to the change
P.S. heatmapAI enhances A/B testing by integrating with tools like Intelligems and Convert. It offers pre-test insights through Revenue-Based Heatmaps and Scrollmaps, helping identify high-impact elements.
During tests, you can track real-time metrics like Revenue Per Session (RPS) and AOV. Post-test, heatmapAI helps analyze cohorts, such as purchasers vs. rage clickers or high vs. low-AOV visitors, to uncover the deeper "why" behind A/B test results.
Tracking and Measuring Success
Establish a measurement framework to track the impact of your optimizations:
Before/After Comparisons
Document baseline metrics before implementing changes:
- Conversion rates for key goals
- Revenue per session
- Average order value
- Cart abandonment rate
- Form completion rate
Revenue Impact Calculation
Quantify the financial impact of each optimization:
Ongoing Monitoring
Continue tracking key metrics to ensure sustained improvement:
- Set up automated reports for key conversion metrics
- Review performance weekly to catch any negative trends
- Compare performance against industry benchmarks
- Update your optimization roadmap based on results
With heatmapAI, you can precisely measure the financial impact of each optimization, tracking key metrics like revenue per session, scroll depth, and high-traffic pages—all in a user-friendly dashboard. This gives you actionable insights to quickly see how your site’s performing and make data-driven decisions for ongoing improvements.

Turn Your Audit Into Action with heatmapAI
Conducting a CRO audit is just the beginning—the real value comes from implementing the findings and continuously optimizing your site. Remember that conversion optimization is not a one-time project but an ongoing process of testing, learning, and improving.
- Identify your biggest conversion barriers using data, not assumptions
- Prioritize changes based on potential revenue impact
- Test and measure everything to ensure positive results
- Create a culture of continuous optimization
- Focus on revenue per session, not just conversion rate
heatmapAI's revenue-focused analytics platform helps you see exactly how each element on your site impacts sales. With tools like CRO engine, session recordings, and comparison features, you can make optimization decisions based on what truly matters—your bottom line.
You made it all the way down there? Give Heatmap a try 🤝
We are the only onsite analytics platform that tells you how to make more money - down to the pixel. Trusted by 1000+ eCommerce brands.

Ashvin Melwani
@ashvinmelwaniWith heatmap, I've been able to figure out what elements actually increase AOV and optimize our landing pages to drive more first purchase profitability, we're up 23% YoY.

How You Can Do It:
1: Download heatmap
2: Wait for 5k sessions
3: Reorganize products based on the highest revenue per session from top left to bottom right.


You made it all the way down here?
Might as well give us a shot, right? It'll change the way you approach CRO. We promise. In fact, our friend Nate over at Original Grain used element-level revenue data from heatmap to identify high-impact areas of his website to test, resulting in a 17% lift in Revenue per Session while scaling site traffic by 43%. Be like Nate. Try heatmap today.
