Shopify is one of the biggest players in the e-commerce industry. But their built-in analytics are pretty limited as don't let you see what visitors are thinking, where they're hovering their mouse, and where they're clicking... all critical insights for more revenue.
There are dropshipping apps, email marketing apps, SMS apps, but when you have a heatmap app, you'll be able to optimize your pages where all the traffic is landing through your other apps, and increase the chance of driving sales.
So in this article, we're going over:
- The 10 top contenders for Shopify heatmaps (you'll want to go with #1)
- Their features, pros/cons, and pricing
- Your best option
Ready? Let's gooo.
TL;DR
| Tool | Focus | Heatmaps | Session Recordings | Integrations | Free Plan/Trial | Data Storage | Website Speed | E-commerce Analytics | Customization | AI Features | Target Audience | Pros | Cons |
|---|---|---|---|---|---|---|---|---|---|---|---|---|---|
| heatmap.com | Revenue-based CRO | Click, Scroll, Interactive | Yes | Shopify | 14-day trial | 365 days | Protected | Revenue per element | Custom boxes | Revenue insights | Ecommerce, CRO | Speed, revenue data, filters, custom boxes | Not free |
| Hotjar | User behavior analysis | Automatic, continuous | Limited/sampled | Shopify, GA, Slack, Zapier | Free plan | 365 days | Not addressed | No revenue data | Limited filters | None | General businesses | Easy to use, integrations, free plan | Pricy, limited filters, no revenue data |
| Lucky Orange | Basic heatmaps & conversion funnels | Basic | Session-based | Zapier, Hubspot | Limited | 30-60 days | Can slow down | No | No | None | Budget-conscious | Integrations, unlimited team members | Slows website, limited storage |
| FigPii | A/B testing & conversion funnels | Heatmaps | Yes | None mentioned | None mentioned | Not mentioned | Not mentioned | No sales data in heatmaps | None mentioned | None mentioned | Ecommerce, conversion focus | Integrated A/B testing, polls | No sales data in heatmaps |
| Crazy Egg | User behavior analysis | Click, Scroll, Confetti, Overlay, List | No | GA, other tools | Free plan | Unlimited per plan | Generally performant | General user behavior | Advanced segmentation | None | General businesses, UX | Precise visualization, multiple formats, segmentation | Complex interface, expensive for high traffic |
| Mouseflow | User behavior analysis | Click, Scroll, Attention, Movement | Yes | Common analytics | Limited free plan | Plan-based | Generally performant | General user behavior | Segmentation by filters | Friction score | General businesses, UX | Improved UX, conversions, easy setup | Data overload, pricing |
| Smartlook | User & app behavior analysis | Click, Scroll, Attention | Yes | None mentioned | Limited free plan | Plan-based | Generally performant | General user behavior | Segmentation by filters | Friction score | Web & app UX | Improved UX, conversions, easy setup | Data overload, pricing, limited free plan |
| UXtweak | UX research | Click, Scroll (integrated with recordings) | Yes (integrated with heatmaps) | Figma, InVision | Free plan | Not stated | Not addressed | General usability | Limited | None | UX researchers | Usability focus, integrated tools | Limited standalone use, UX focus |
| Plerdy | Website optimization | Click, Scroll, Mouse Movement, Sequences | Separate | GA | Free plan | Plan-based | Generally performs well | Sales tracking | Segmentation by filters | None | All businesses | Easy to use, insights | Learning curve, complex, limited features |
| Hitsteps | Real-time analytics & live chat | Click, Page Analysis | Yes | WordPress, Shopify, Joomla | Free plan | Plan-based | Not addressed | General user behavior | Segmentation mentioned | None | All businesses | Easy setup, real-time, detailed reports | Limited free plan, no mobile app, heatmap issues |
1) heatmap.com - Best Heatmap App That Won't Slow Down Your Shopify Site
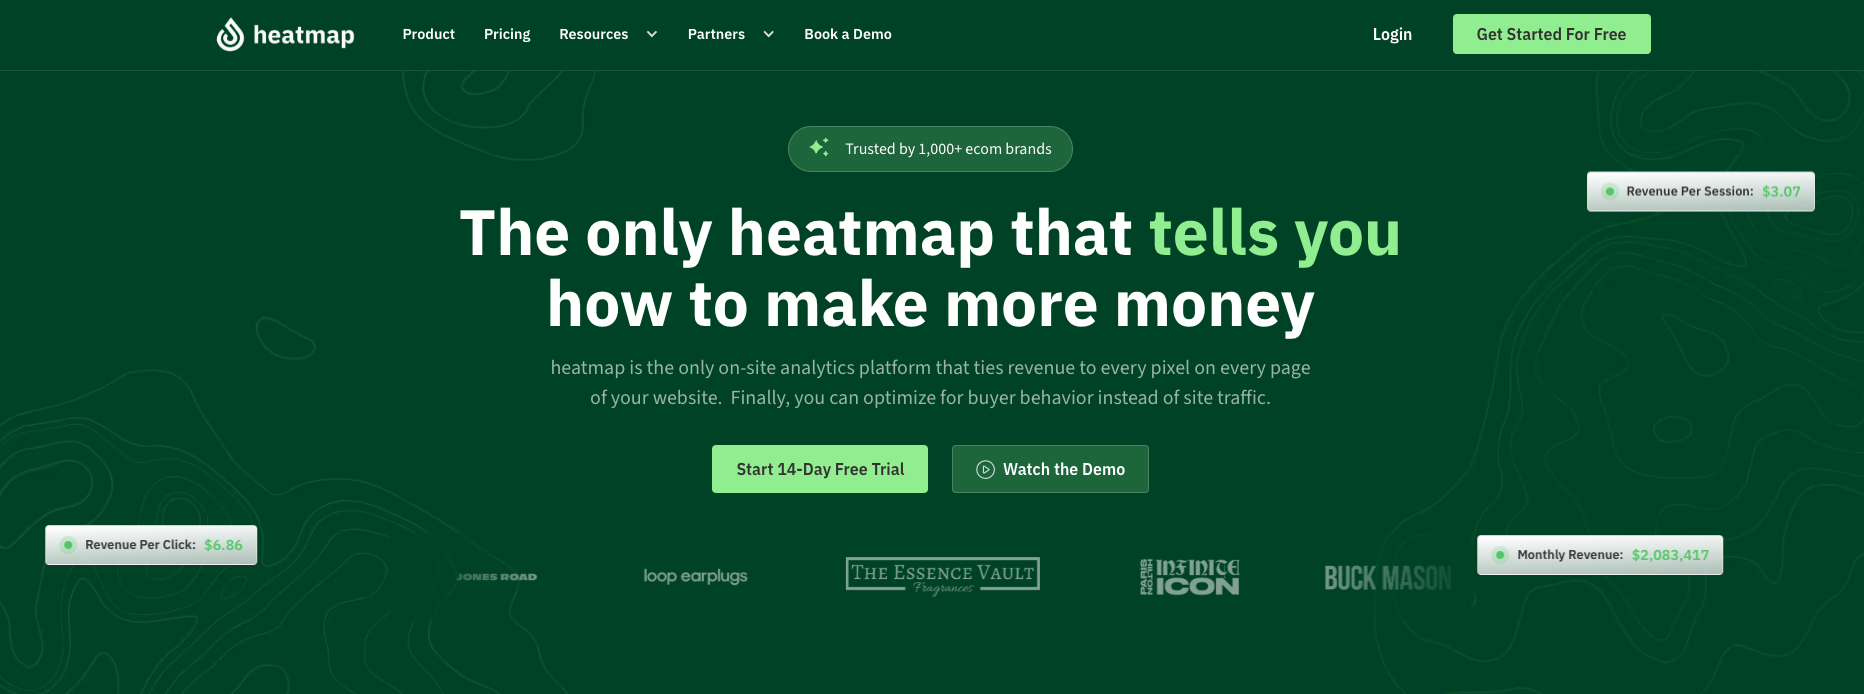
Heatmap.com goes beyond basic click tracking by showing real sales metrics and conversion data for every element of your store. With true revenue tracking, real-time heatmap overlays, and generous page view limits (10M on free plans, up to 100M premium), it's built specifically for scaling eCommerce brands.
heatmap's Features
- It's easy to install
- Website speed protection (other heatmap software slows down your site significantly, but heatmap.com doesn't)
- Advanced heatmap filters (for purchases, e-commerce metrics, and sales channels like Facebook or TikTok Ads)
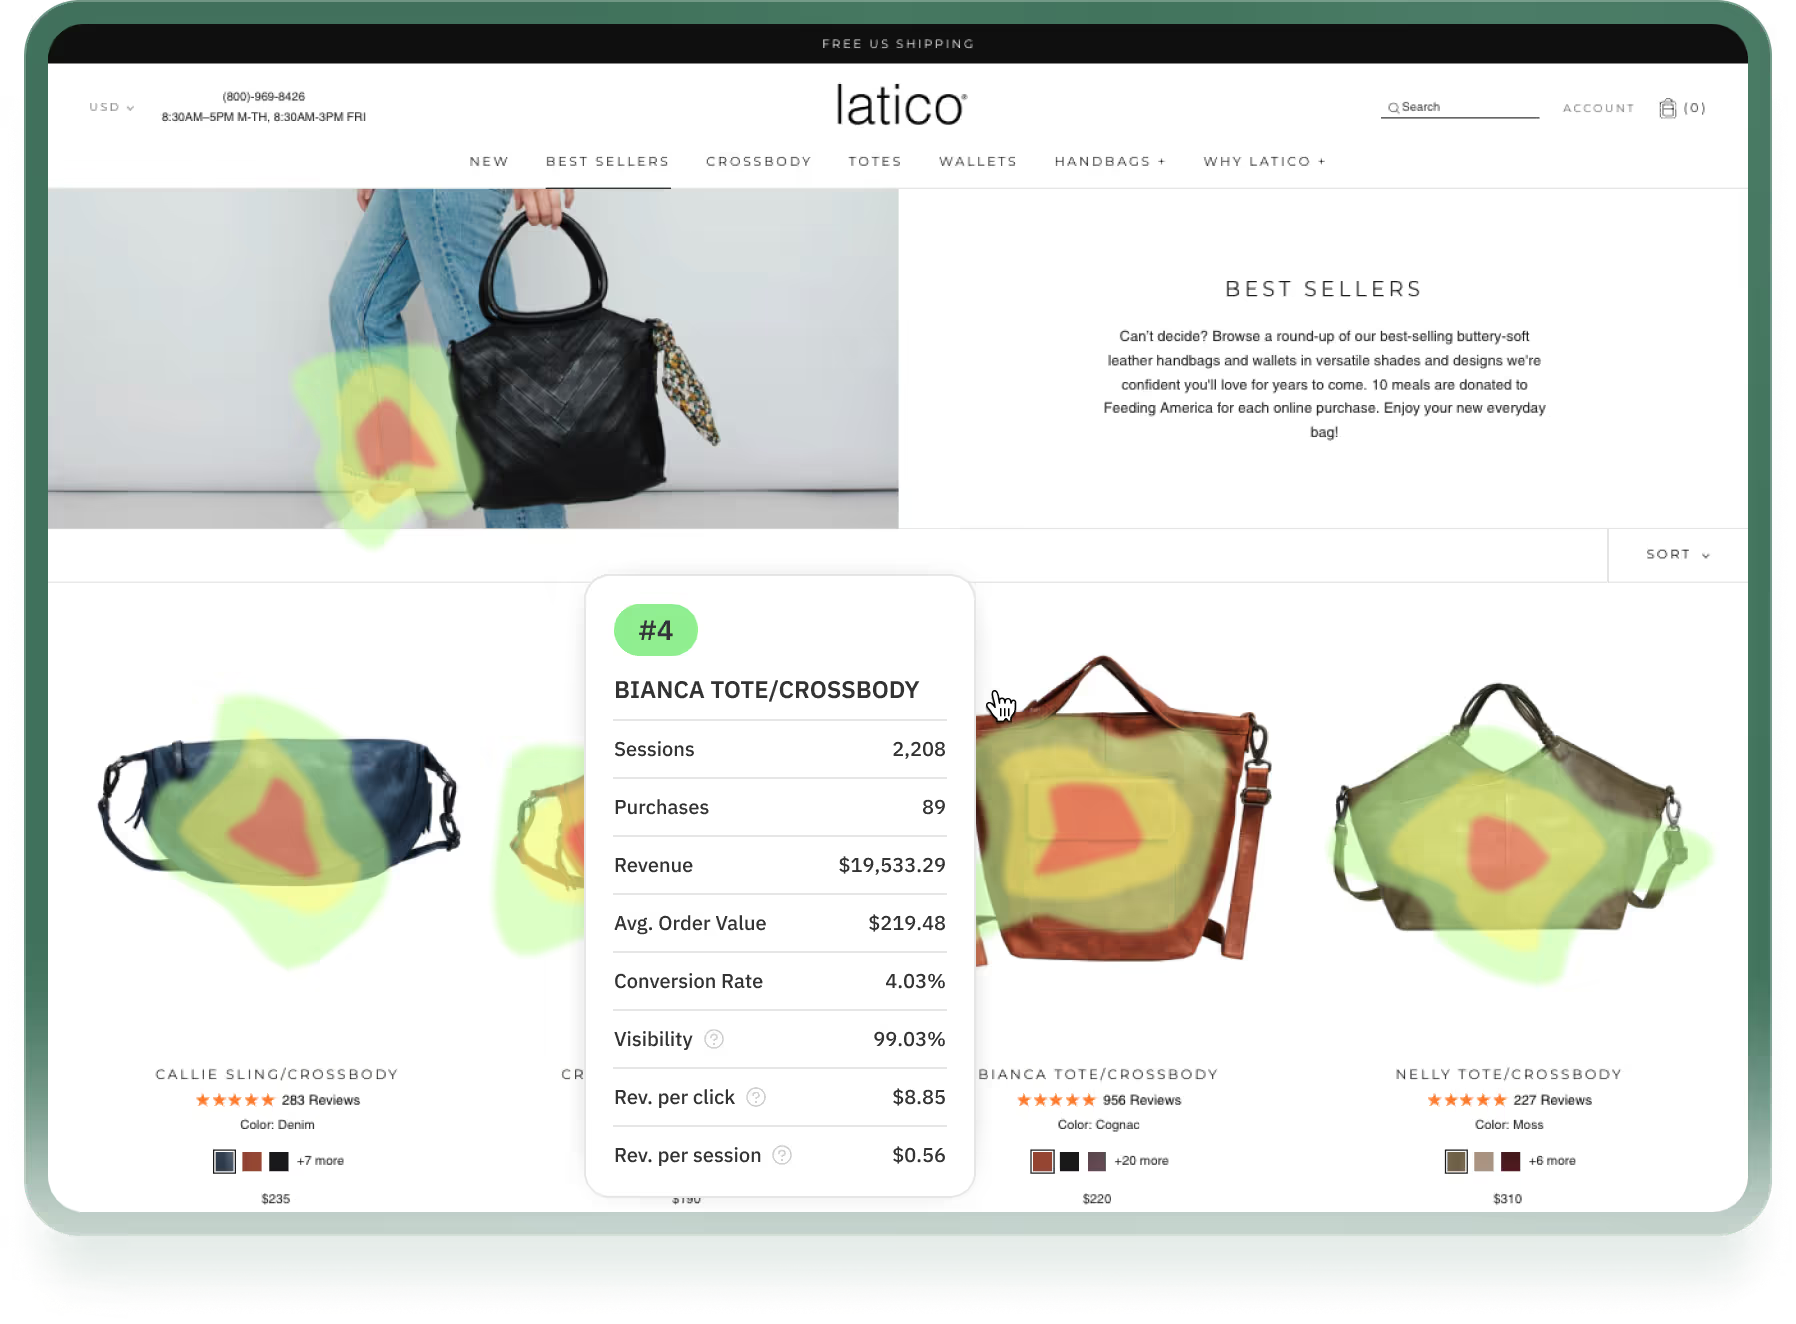
- Revenue metrics for every element on your page to see which are driving revenue (no other heatmap in the world can do this)
- The industry's only "custom box" functionality that allows you to group page elements to view combined heatmap data from all elements in your box
Pros
- It doesn't affect site speed for users, unlike Hotjar, Crazyegg, Lucky Orange, and other popular heatmap products (check out our split test)
- Provides valuable e-commerce and revenue data, not just the number of clicks
- Includes more data filters than competitors
- "Custom box" aggregation of page elements for deeper analysis
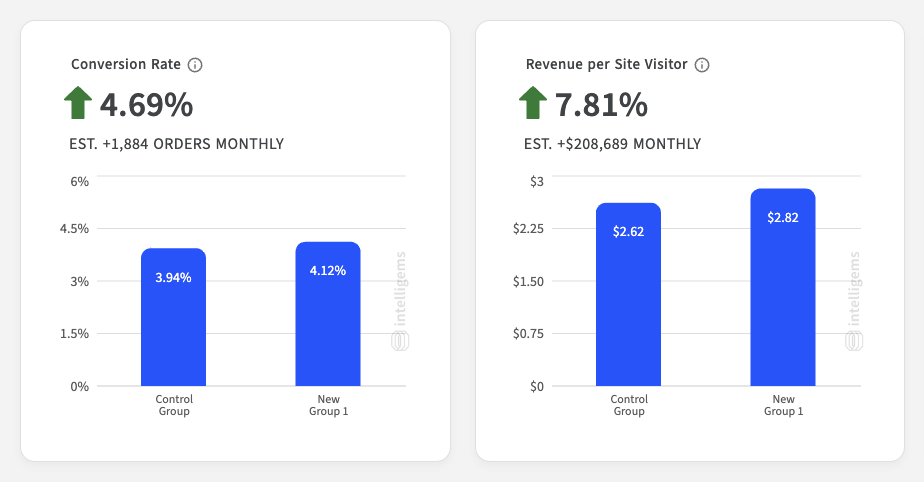
Case Study: How Obvi Increased Revenue Per Session by 7.8% with heatmapAI
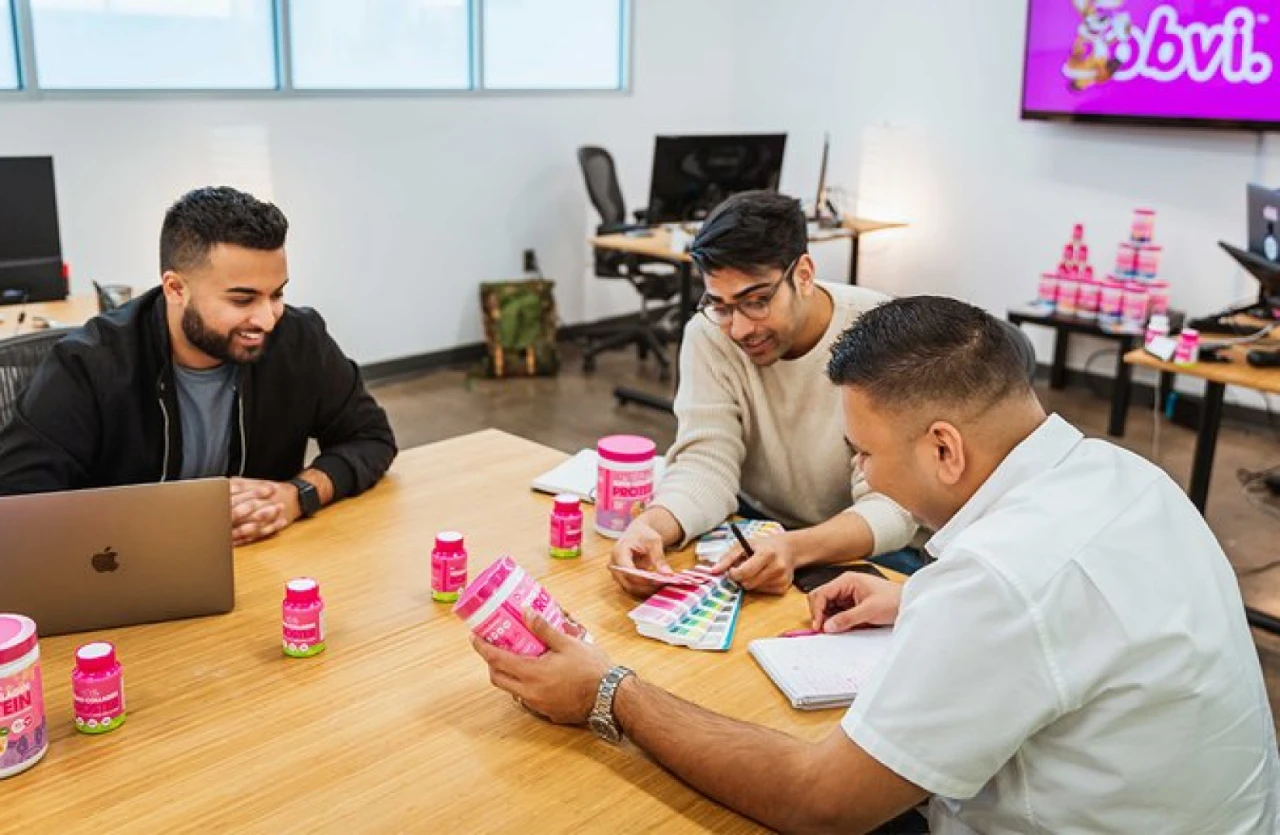
To maximize revenue from their main paid lander, Obvi needed to better understand user behavior. They turned to Heatmap for answers.
- +4.69% increase in Conversion Rate
- +7.81% increase in Revenue Per Session
"With Heatmap, I've been able to figure out what elements actually increase AOV and optimize our landing pages to drive more first-purchase profitability. We're up 23% YoY." - Ash Melwani, Co-Founder + CMO @ Obvi
Challenge: Balancing scale and profitability is a constant challenge for 8-figure DTC brands.
Solution: HeatmapAI unlocked key insights used for split testing.
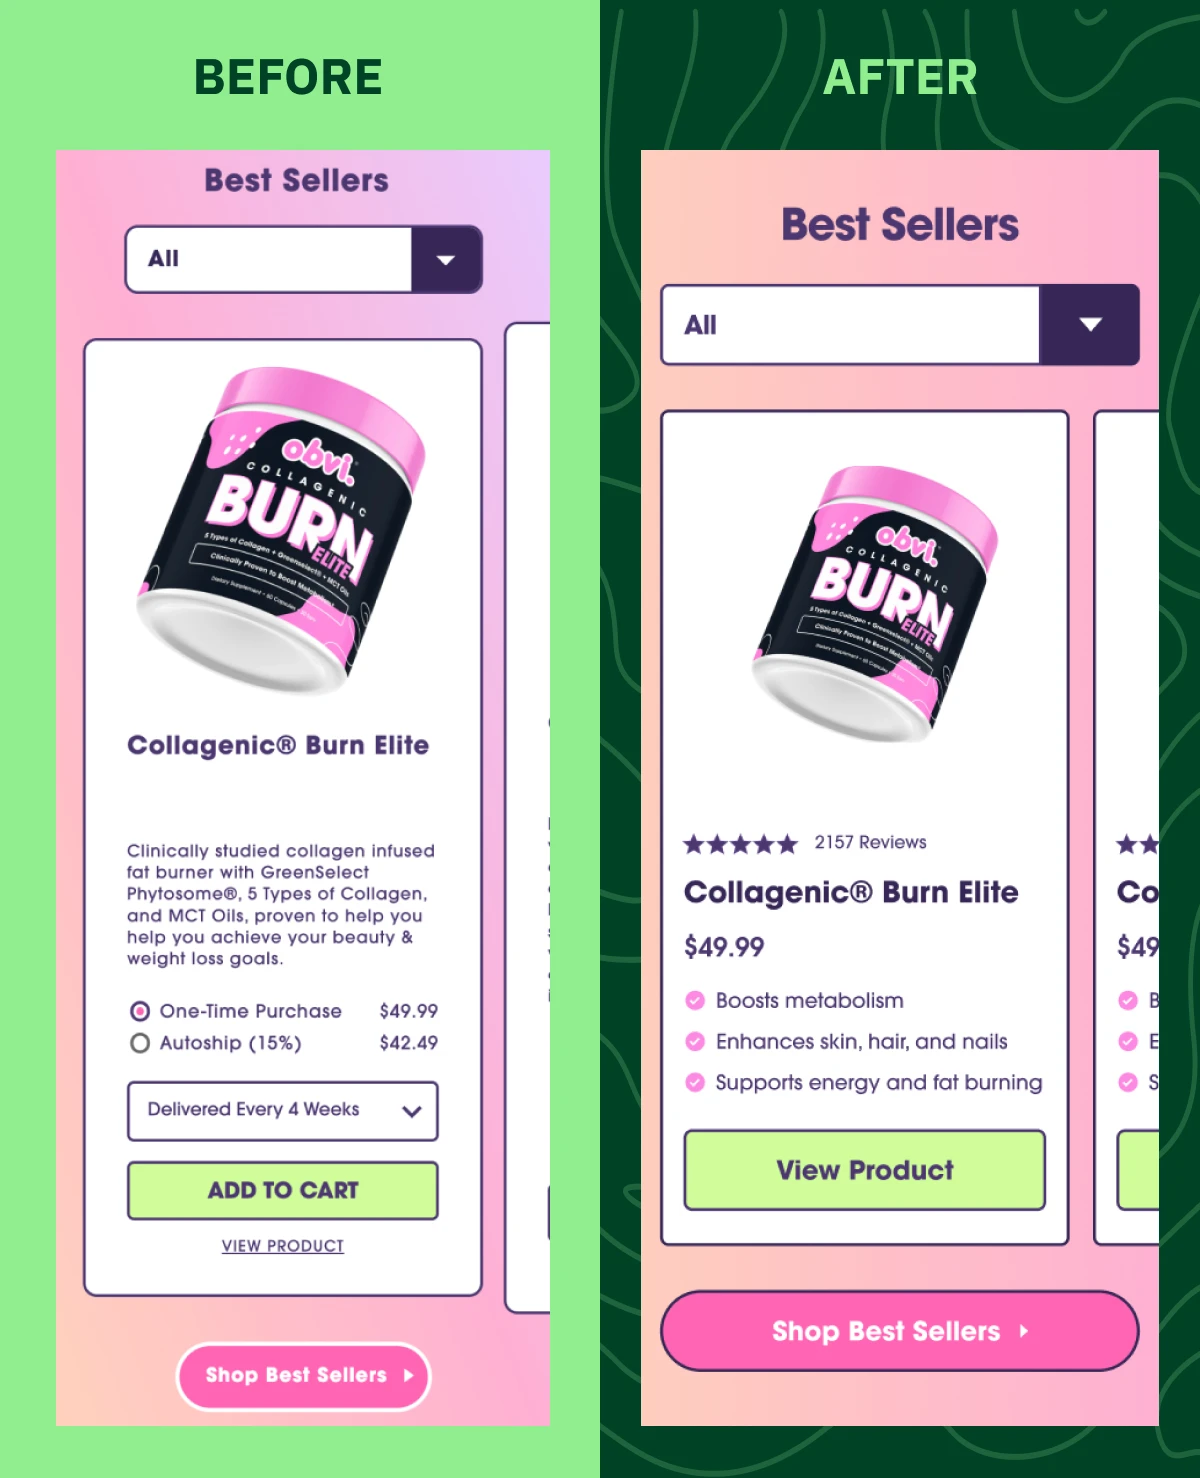
Results: A single heatmapAI recommendation improved both RPS & CVR.
2) Hotjar Observe
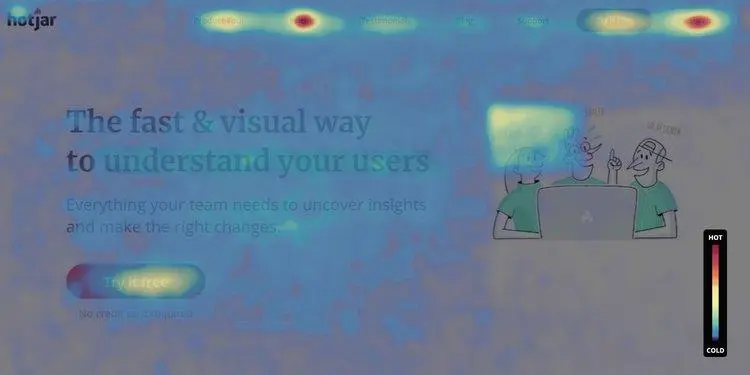
Hotjar Observe is one of the staple names in this space that offers fundamental heatmap capabilities with click and scroll tracking via color overlays. But its premium pricing and integration limitations, coupled with a one-size-fits-all approach that isn't tailored for ecommerce, can be difficult to justify when more Shopify-focused solutions exist in the market.
Hotjar's Features
- Automatic and continuous dynamic heatmaps
- Event APIs
- Trend analysis
- Connects with platforms including Shopify, Google Analytics, Slack, and Zapier
- 365 days data storage
The problem with Hotjar
- One of the priciest options on the market because it's session-based, which is not eCommerce-friendly (high-traffic sites pay a fortune)
- Limited filter options for deeper analysis
- No revenue data showed anywhere on the platform
- Access to customer communication and engagement tools requires additional subscriptions (+$48 - $112 per month) on top of the heatmap subscription fee
- Not providing detailed insights on WHAT TO DO with the data in front of users
This is why eCommerce owners prefer more revenue-focused alternatives like heatmap.com. Check it out:
| Details | heatmap.com | Hotjar |
|---|---|---|
| Pricing | Starts at $117/mo ($0 - 4.9M ARR) | $99/month (500 daily sessions). |
| Heatmaps | Interactive heatmaps and scrollmaps with revenue attribution. | Standard and zone-based heatmaps (higher-tier plans). |
| Session Recordings | Unlimited with advanced filters and session info. | Limited access based on plan; sampling starts at Growth. |
| AI Recommendations | Yes, weekly AI-driven revenue insights. | No AI recommendations for CRO optimization. |
| Free Plan/Trial | 14-day free trial with full access. | Free plan (500 daily sessions). |
- Choose heatmap.com if you’re an eCommerce business or CRO-focused agency that needs revenue-based analytics and actionable AI insights.
- Choose Hotjar if you need a more general platform for user experience, product feedback, and engagement metrics, particularly for SaaS or broader UX-focused industries.
Read Next: We Tried the Top 10 Hotjar Alternatives - Here's #1
3) Lucky Orange
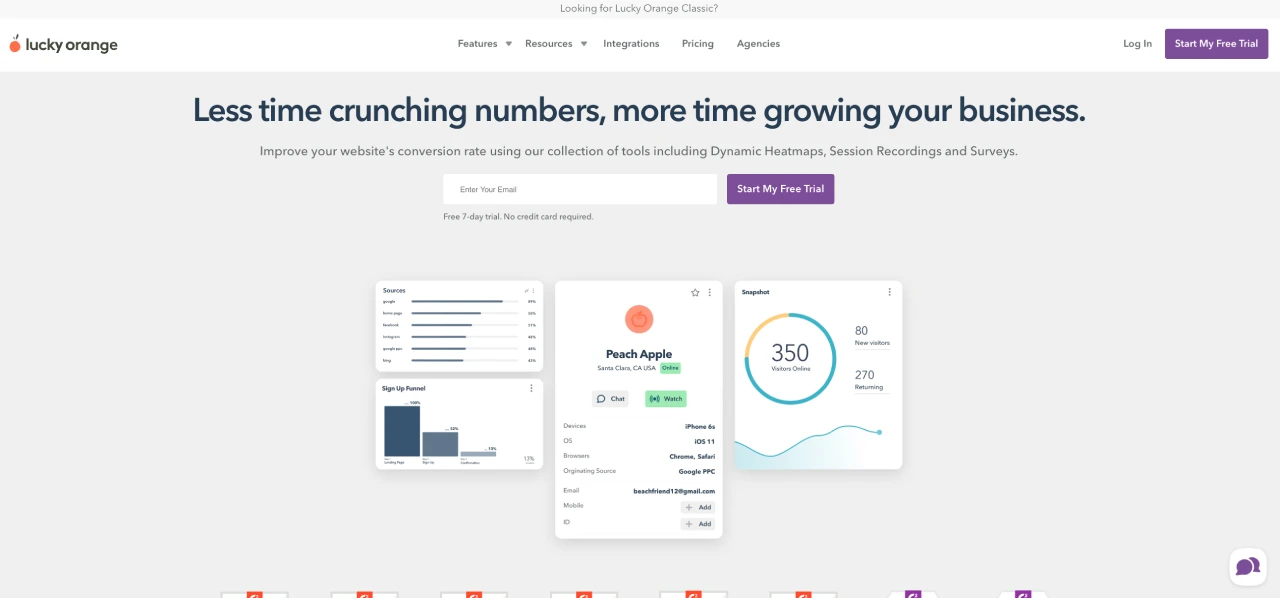
Are you operating your website on a tight budget? Well, Lucky Orange is one of the cheapest heatmap options available on the Shopify app store, but be warned, it's also one of the least advanced, unlike Heatmap.com.
When you register with Lucky Orange, they'll give you access to their tools like heatmaps and conversion funnels, these can be integrated directly into your Shopify store. You'll also have first-person feedback available to you, which comes in live chats, form analytics, and informative surveys.
One of the major concerns website owners have when using Lucky Orange Shopify heatmap tool is that they only store data between 30 and 60 days. This means if you ever wanted to go back over a previous problem you had in the future, you won't be able to once the limit is up.
Lucky Orange Features
- Basic heatmaps
- Session-based visitor recordings
- Live chats and surveys
Pros
- Integrates with Zapier, Hubspot, and more
- All plans include unlimited team members
Cons
- No integration with Shopify e-commerce analytics
- Limited storage of recorded heatmaps (30-60 days)
- Makes websites very slow and can hurt your conversion rate
| Feature | Lucky Orange | heatmap.com |
|---|---|---|
| Pricing | Starts at $39/mo | Starts at $117/mo ($0 - 4.9M ARR) |
| Heatmaps | Basic heatmaps | Interactive heatmaps with revenue attribution |
| Free Plan | Yes but limited | 14-day free trial with full access |
| Data Storage | 30-60 days | Generous limits (10M on free plan) |
| Website Speed | Can slow down website | Zero impact on website speed |
| Ecommerce Analytics | No | Revenue metrics for every element |
| Customizable Heatmap Data | No | Custom box functionality for grouped element data |
| AI Features | No | Weekly AI-driven revenue insights |
- Choose heatmap.com if you’re an eCommerce business or CRO-focused agency that needs revenue-based analytics and actionable AI insights to optimize your conversion rate.
- Choose Lucky Orange if you are a budget-conscious business and you are okay with basic features and limited data storage.
Read next:
- 7 Best Lucky Orange Alternatives for Enhanced Visitor Tracking (2024)
- Hotjar vs Lucky Orange (Tried, Compared) - Here's the Winner
4) FigPii
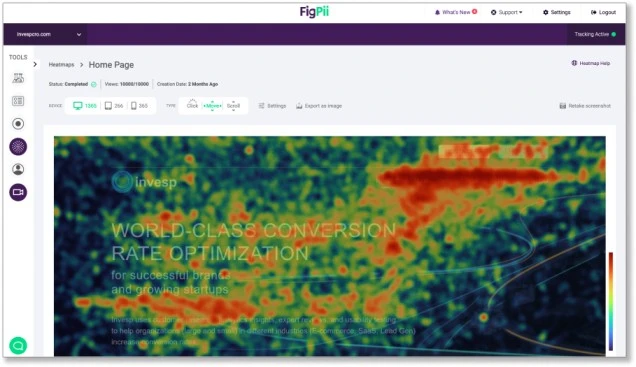
Our next heatmap tool for e-commerce websites is FigPii; these guys place a huge emphasis on measuring a webpage's performance through A/B testing and split URL testing so their users can use the results to increase the success of their campaigns.
One of their specialties that seems to be a hit with their users is their use of heatmaps to fix conversion funnels. This move has been seen to help a lot of their customers achieve their campaign goals and bump up their conversions. It's not a quick solution though as it doesn't actually show how you can turn these clicks into actual sales numbers and data.
FigPii Features
- Heatmaps
- Session recordings
- Polls
- A/B testing
Pros
- Integrated A/B testing
- Polls to website visitors
- Record and replay visitor actions
Cons
- Can't see sales data next to heatmap results
| Feature | heatmap.com | FigPii |
|---|---|---|
| Pricing | Starts at $117/mo ($0 - 4.9M ARR) | Starts at $149.99/mo |
| Heatmaps | Interactive heatmaps with revenue attribution | Heatmaps |
| Session Recordings | Unlimited recordings with advanced filters | Record and replay visitor actions |
| Free Plan | 14-day free trial with full access | Yes with limited features |
| Data Storage | Generous limits (10M on free plan) | N/A |
| Website Speed | No impact on website speed | N/A |
| AI Features | Weekly AI-driven revenue insights | N/A |
| A/B Testing | Yes | A/B testing |
5) Crazy Egg
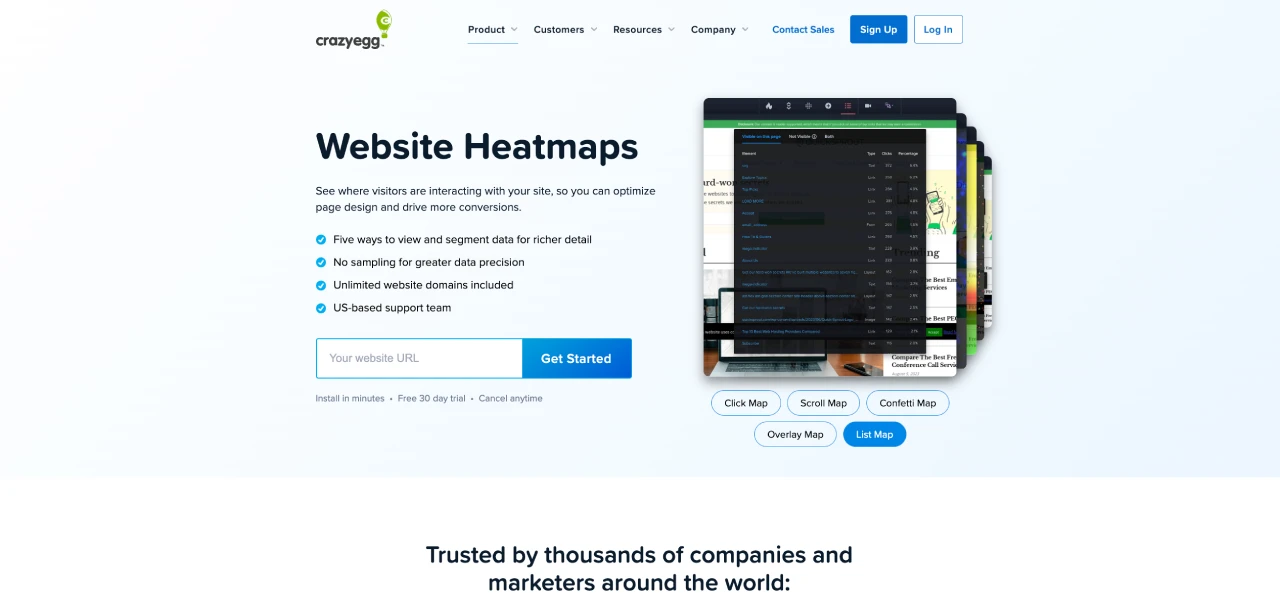
Crazy Egg empowers you to visualize visitor behavior on your website, enabling data-driven decisions to boost conversions. Unlike basic click tracking tools, Crazy Egg provides rich insights into how visitors interact with your web pages, helping you identify areas for improvement and optimize the user experience.
Key Features
- Heatmaps: The cornerstone of Crazy Egg's functionality. These visual representations reveal where visitors click, scroll, and engage with your pages, providing insights into high-performing areas, friction points, and content effectiveness.
- Multiple Heatmap Formats: Crazy Egg goes beyond basic heatmaps, offering Click Maps, Scroll Maps, Confetti Maps, Overlay Maps, and List Maps. This variety allows you to gain deeper insights through various data visualizations.
- Data Segmentation: Segment your heatmap data by various filters like date range, traffic source, user type, device, and custom variables. This empowers you to understand how different visitor segments interact with your website.
- A/B Testing: Test variations of your web pages and identify the versions that drive the most conversions.
- Additional Features: Crazy Egg offers unlimited website tracking within a plan, US-based customer support, and integrates with popular tools like Google Analytics.
Pros
- Precise data visualization: Heatmaps provide a clear picture of visitor behavior.
- Multiple heatmap formats: Gain insights through click maps, scroll maps, and more.
- Advanced segmentation: Analyze user behavior based on various criteria.
- A/B testing functionality: Test different website variations to optimize for conversions.
- Unlimited domains: Track heatmaps across all your websites within a plan.
- US-based support: Benefit from responsive customer service.
Cons
- The interface can be complex for new users, requiring a learning period to fully utilize all features.
- Pricing can become expensive for websites with high traffic volumes or extensive tracking needs.
- Setting up A/B tests may require some technical knowledge or familiarity with web development.
| Feature | heatmap.com | Crazy Egg |
|---|---|---|
| Pricing | Starts at $117/mo ($0 - 4.9M ARR) | Starts at $297/mo |
| Heatmaps | Interactive heatmaps with revenue attribution | Multiple heatmap formats (Click Maps, Scroll Maps, Confetti Maps, Overlay Maps, List Maps) |
| Free Plan/Trial | 14-day free trial with full access | 30 days free trial |
| Data Storage/Limits | Generous limits (10M on free plan) | Unlimited website tracking within a plan |
| Website Speed | Website speed protection | Not specifically addressed, but generally considered performant |
| AI Features | Weekly AI-driven revenue insights | No specific AI features mentioned |
| A/B Testing | Yes | A/B testing functionality |
6) Mouseflow
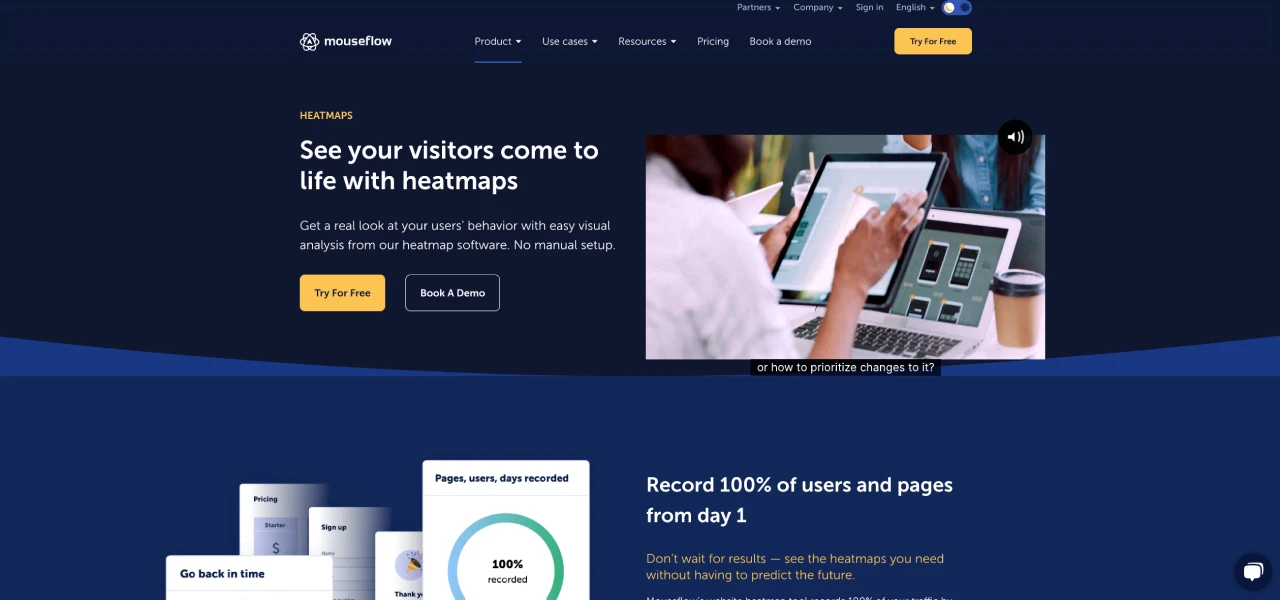
In today's competitive digital landscape, understanding how users interact with your website is essential for success. Mouseflow offers a robust suite of tools designed to provide deep insights into user behavior, enabling data-driven decisions that optimize user experience and boost conversions.
Unlike traditional analytics platforms that focus solely on quantitative data like pageviews and bounce rates, Mouseflow goes further by visualizing actual user interactions.
Key Features
- Heatmaps: Gain a visual understanding of where visitors click, scroll, and engage with your pages. Mouseflow offers various heatmap options, including click maps, scroll maps, attention maps, and movement maps.
- Session Recordings: Replay visitor sessions to see exactly how they navigate your website, pinpointing areas of confusion or frustration.
- Friction Score: Identify the pages and user interactions with the lowest satisfaction scores, allowing you to prioritize optimization efforts.
- Conversion Funnels: Track visitor flow through your conversion funnels, identifying drop-off points and areas for improvement.
- Comprehensive Data Analysis: Analyze user behavior based on various filters like device, location, traffic source, and custom variables.
Pros
- Improved User Experience: By understanding user behavior, you can identify and address pain points, leading to a more enjoyable and efficient user experience.
- Enhanced Conversions: Optimize your website for conversions by identifying elements that drive user engagement and calls to action.
- Data-Driven Decisions: Gain actionable insights to support informed website optimization strategies.
- Easy Setup and Use: Mouseflow offers a user-friendly interface and requires no complex setup procedures.
Cons
- Data Overload: The vast amount of data generated by Mouseflow can be overwhelming for some users, requiring a strategic approach to analysis.
- Pricing: Mouseflow pricing plans may not be suitable for all budgets, particularly for websites with high traffic volumes.
- Limited Free Plan: The free plan offers restricted features and session recording capabilities.
| Feature | heatmap.com | Mouseflow |
|---|---|---|
| Pricing | Starts at $117/mo ($0 - 4.9M ARR) | Starts at $117/mo (50k sessions) |
| Heatmaps | Interactive heatmaps with revenue attribution | Multiple heatmap formats (Click Maps, Scroll Maps, Attention Maps, Movement Maps) |
| Free Plan/Trial | 14-day free trial with full access | Limited free plan |
| Data Storage/Limits | Generous limits (10M on free plan) | Not explicitly stated, but likely tied to plan limits |
| Website Speed | Website speed protection | Not specifically addressed, but generally considered performant |
| AI Features | Weekly AI-driven revenue insights | Friction Score to identify areas of user frustration |
| A/B Testing | Yes | Conversion Funnels to track user flow and identify drop-off points |
Read Next: Mouseflow vs Hotjar: Key Features, Pricing, and Best Use Cases
7) Smartlook
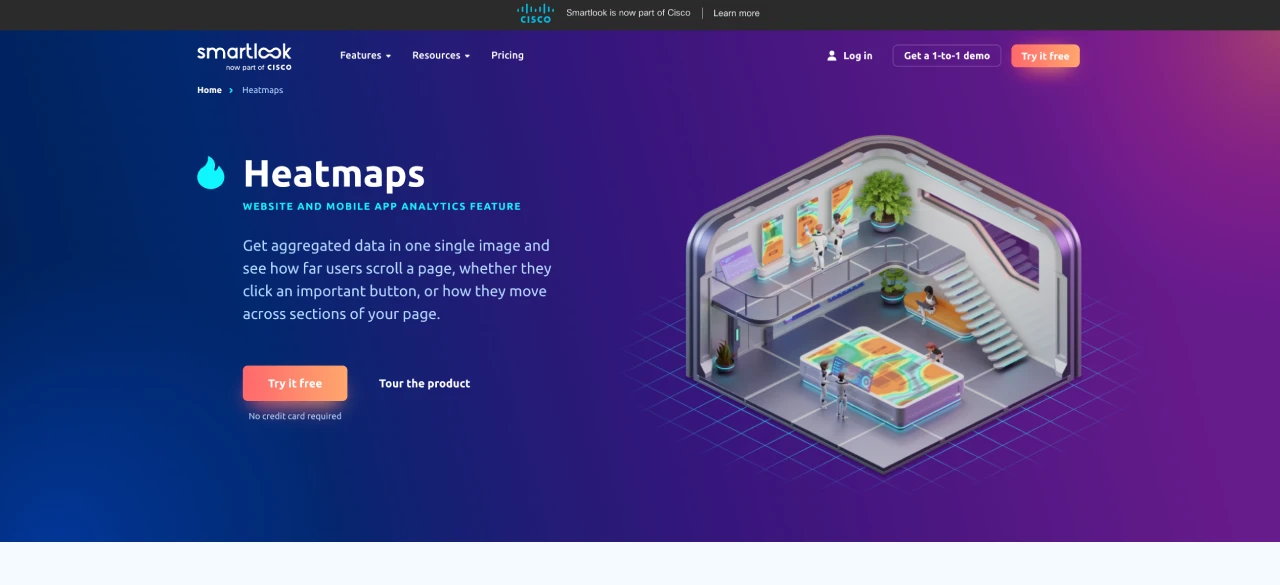
Smartlook is a powerful website and mobile app analytics platform that empowers you to see your digital products through the eyes of your users. It goes beyond traditional quantitative analytics by providing qualitative insights into user behavior, enabling you to understand the "why" behind user actions.
Key Features
- Session Recordings: Replay user interactions (clicks, scrolls, taps) to understand user journeys and identify friction points.
- Heatmaps: Visualize click, scroll, and attention patterns on pages.
- Conversion Funnels: Track user flow and identify drop-off points.
- Friction Score: Identify pages and interactions with low satisfaction.
- Data Analysis: Analyze user behavior by device, location, traffic source, etc.
Pros
- Enhanced User Experience: By understanding user behavior, you can identify and address usability issues, leading to a more enjoyable and efficient user experience.
- Improved Conversions: Optimize your website or app for conversions by pinpointing elements that drive user engagement and calls to action.
- Data-Driven Decisions: Gain actionable insights to support informed website or app optimization strategies.
- Easy Setup and Use: Smartlook offers a user-friendly interface and requires no complex setup procedures, making it accessible to users of all technical backgrounds.
Cons
- Data Overload: The vast amount of data generated by Smartlook can be overwhelming for some users. A strategic approach to data analysis is recommended to extract the most value from the platform.
- Pricing: Smartlook pricing plans may not be suitable for all budgets, particularly for websites or apps with high traffic volumes. Consider your needs and budget before choosing a plan.
- Limited Free Plan: The free plan offers restricted features and session recording capabilities.
| Feature | heatmap.com | Smartlook |
|---|---|---|
| Pricing | Starts at $117/mo ($0 - 4.9M ARR) | Starts at $117/mo (5k sessions) |
| Heatmaps | Interactive heatmaps with revenue attribution | Click heatmaps, scroll maps, and attention maps |
| Free Plan/Trial | 14-day free trial with full access | Limited free plan |
| Data Storage/Limits | Generous limits (10M on free plan) | Not explicitly stated, but likely tied to plan limits |
| Website Speed | Website speed protection | Not specifically addressed, but generally considered performant |
| AI Features | Weekly AI-driven revenue insights | Friction Score to identify areas of user frustration |
| A/B Testing | Yes | No |
8) UXtweak
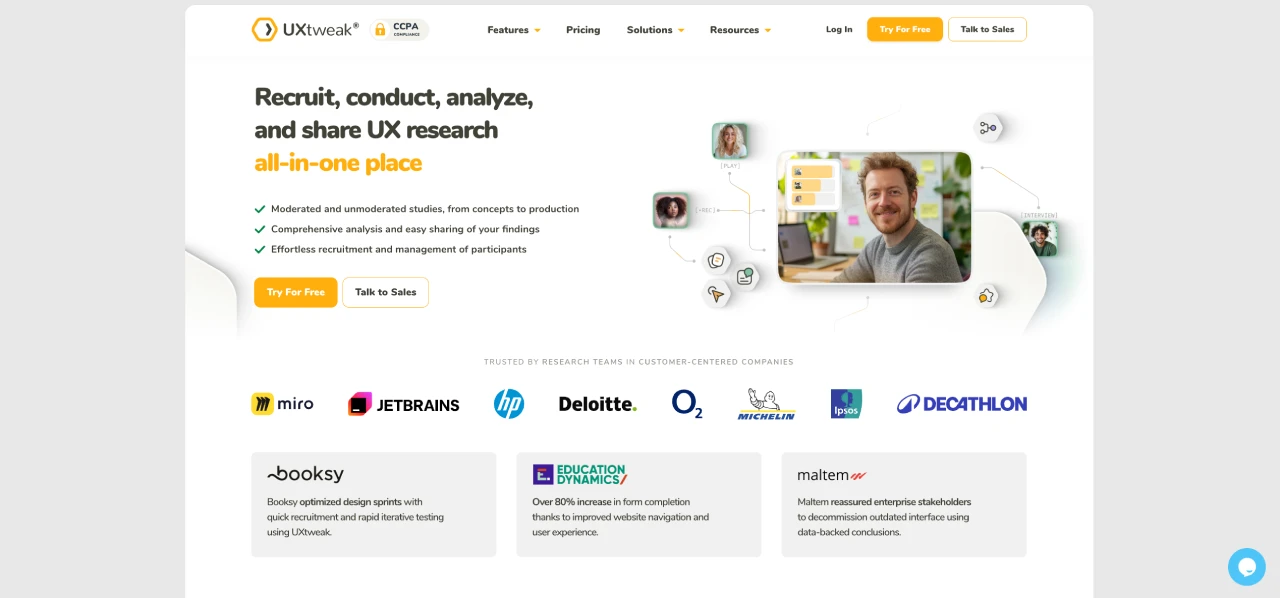
UXtweak is a user experience (UX) research platform offering a suite of tools to understand user behavior, including heatmaps. Heatmaps in UXtweak help visualize user interactions on websites and prototypes, revealing valuable insights to improve usability and optimize conversions.
Key Features
- Session Recordings with Heatmaps: Integrated recordings and heatmaps show aggregated user behavior within sessions.
- Click Heatmaps: Visualize click activity (hotspots and cold spots).
- Scroll Heatmaps: Visualize scroll depth to understand content engagement.
- UXtweak Tool Integration: Combines heatmaps with other UX research methods (card sorting, etc.).
Pros
- Identify Usability Issues: Heatmaps quickly reveal interaction and navigation problems.
- Optimize Conversions: Understand user engagement to improve conversion rates.
- Data-Driven Design Decisions: Use visual data to justify design changes.
- Improved User Experience: Create a more user-friendly website or prototype.
Cons
- Limited Standalone Use: Heatmaps are integrated with other tools, not a standalone feature.
- Focus on Usability Testing: Primarily a usability testing platform, not a dedicated heatmap tool.
| Feature | heatmap.com | UXtweak |
|---|---|---|
| Pricing | Starts at $117/mo ($0 - 4.9M ARR) | Starts at $129.9/mo |
| Heatmaps | Interactive heatmaps with revenue attribution | Click heatmaps, scroll heatmaps, integrated with session recordings |
| Free Plan/Trial | 14-day free trial with full access | Free plan available |
| Data Storage/Limits | Generous limits (10M on free plan) | Not explicitly stated |
| Website Speed | Website speed protection | Not specifically addressed |
| AI Features | Weekly AI-driven revenue insights | No specific AI features for heatmaps |
| A/B Testing | Yes | A/B testing is a separate feature, not directly tied to heatmaps |
9) Plerdy
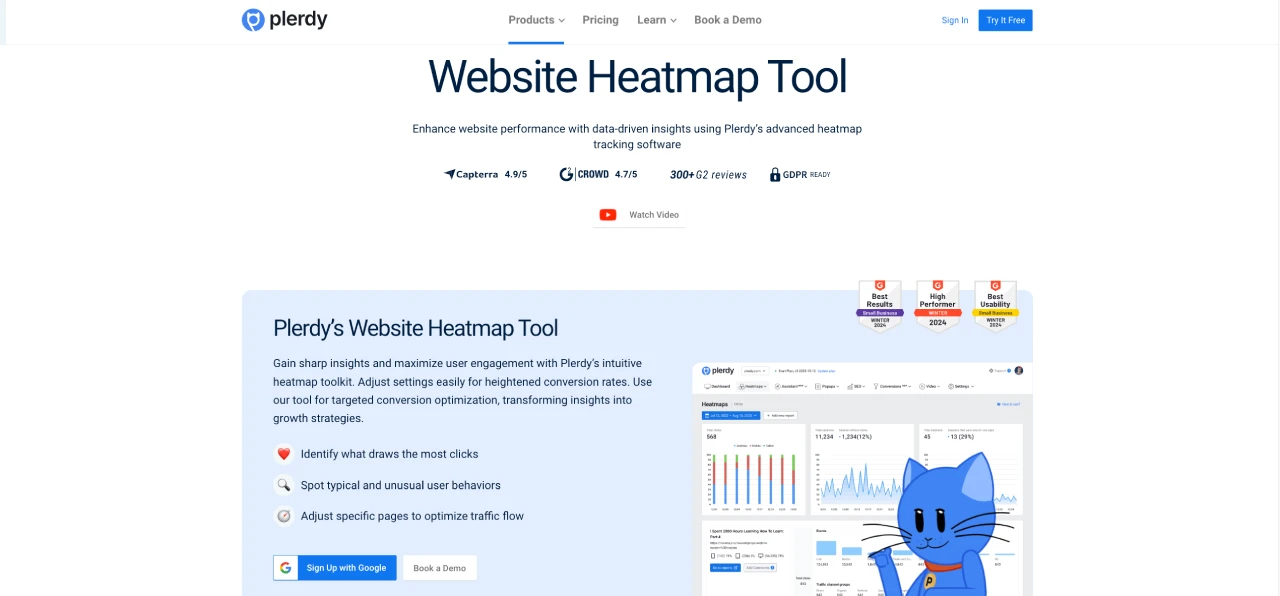
Plerdy is a website optimization software suite that offers a variety of tools to help businesses improve user experience and conversion rates. One of its key features is heatmap tracking, which allows you to visualize how users interact with your website by clicking, scrolling, and moving their mouse cursor.
Key Features
- Click Heatmaps: Visualize clicks, identify popular elements and dead clicks.
- Scroll Heatmaps: Visualize scroll depth for content engagement.
- Mouse Movement Heatmaps: Track cursor movement for user attention insights.
- Click Sequences: Analyze click order to understand user flow.
- Segmentation: Segment heatmap data by device, traffic source, user groups.
- Dynamic Element Tracking: Track interactions with dynamic elements (menus, pop-ups).
- Data Visualization: Clear visual presentation of heatmap data.
Pros
- Ease of use: Plerdy is relatively easy to use, even for beginners.
- Insights: Plerdy provides a wealth of insights into user behavior, which can help you improve your website's design and functionality.
- Heatmaps: Plerdy's heatmaps are a powerful tool to analyze visitor behavior.
- Effectiveness: Plerdy can be an effective tool for improving website conversion rates.
- User Experience: Plerdy can help you improve the user experience of your website.
Cons
- Learning Curve: There can be a bit of a learning curve to using Plerdy's full range of features.
- Complexity: Some users may find Plerdy's dashboard to be overwhelming due to the many features and data points.
- Limited Features: Plerdy's A/B testing features may not be as comprehensive as some other A/B testing tools.
| Feature | heatmap.com | Plerdy |
|---|---|---|
| Pricing | Starts at $117/mo ($0 - 4.9M ARR) | Starts at $32/mo |
| Heatmaps | Interactive heatmaps with revenue attribution | Click heatmaps, scroll heatmaps, mouse movement heatmaps, click sequences, dynamic element tracking |
| Free Plan/Trial | 14-day free trial with full access | Free plan available |
| Data Storage/Limits | Generous limits (10M on free plan) | Data storage depends on the chosen plan |
| Website Speed | Website speed protection | Not specifically addressed, but generally performs well |
| AI Features | Weekly AI-driven revenue insights | No specific AI features for heatmaps |
| A/B Testing | Yes | A/B testing is a separate feature |
10) Hitsteps Web Analytics
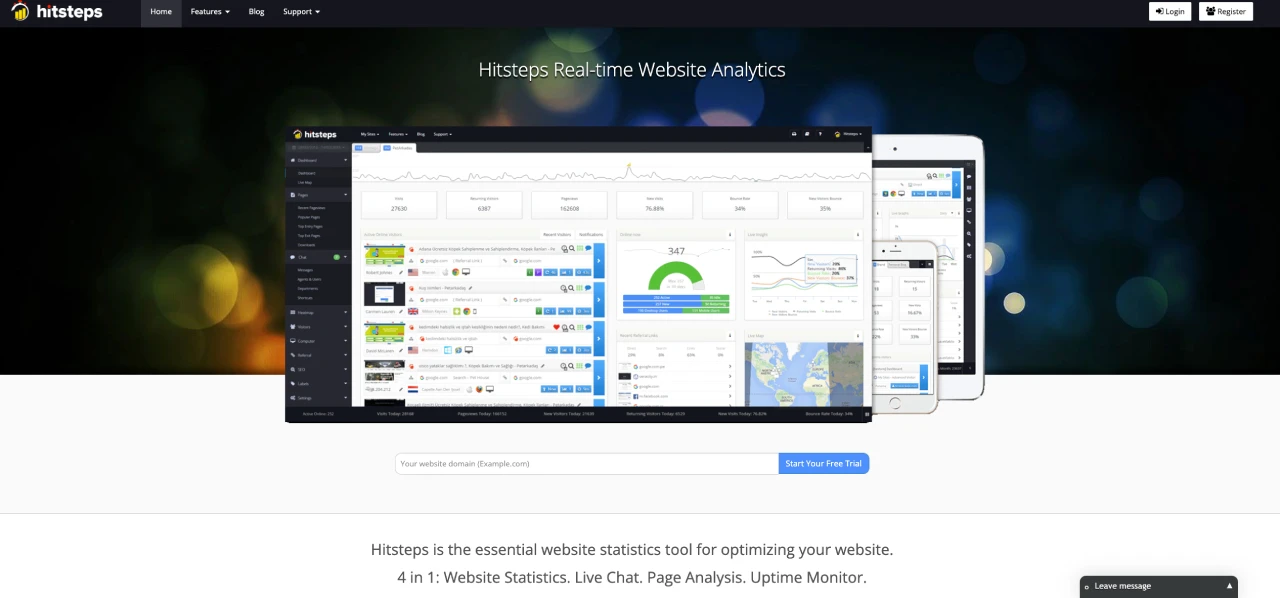
Hitsteps is a website analytics platform that provides real-time visitor tracking, live chat, and detailed reports to help businesses understand their website traffic and improve user engagement.
Key Features
- Click Heatmaps: Visualize clicks, identify popular & ignored elements.
- Page Analysis: Detailed click data for individual page elements.
- Real-time Heatmaps: Near-instant heatmap data updates.
Pros
- Hitsteps is user-friendly and easy to set up, making it accessible even for beginners.
- The platform provides real-time insights into website traffic, enabling quick and informed decisions.
- Hitsteps offers detailed reports that provide a comprehensive understanding of website traffic.
- The built-in live chat feature facilitates real-time engagement with visitors, potentially boosting conversions.
- Heatmaps and visitor recordings offer valuable visual insights into user behavior on the website.
- Hitsteps include uptime monitoring to ensure website availability and promptly identify issues.
- Traffic segmentation allows for more granular analysis of user behavior based on various criteria.
- Hitsteps offers a free plan and affordable paid plans, making it cost-effective for various budgets.
Cons
- The free plan has limitations, such as a restricted number of tracked visitors per month.
- Hitsteps lacks a dedicated mobile app for tracking website traffic on mobile devices.
- Some users have reported occasional issues with the heatmap feature's functionality.
- Certain features, like advanced visitor segmentation and custom reporting, are limited to paid plans.
| Feature | heatmap.com | Hitsteps Web Analytics |
|---|---|---|
| Pricing | Starts at $117/mo ($0 - 4.9M ARR) | Starts at $4.99/mo |
| Heatmaps | Interactive heatmaps with revenue attribution | Click heatmaps, detailed click data per element ("Page Analysis"), likely real-time updates |
| Free Plan/Trial | 14-day free trial with full access | Free plan available |
| Data Storage/Limits | Generous limits (10M on free plan) | Limits likely tied to chosen plan |
| Website Speed | Website speed protection | Not specifically addressed |
| AI Features | Weekly AI-driven revenue insights | No specific AI features mentioned |
| A/B Testing | Yes | No |
Why Heatmap Analytics is a MUST for Your Shopify Site
- See exactly where sales drop off - track mouse movements and clicks to identify what's making customers abandon their carts
- Spot UX issues instantly - visualize where users get stuck, confused, or click dead areas instead of digging through analytics
- Find hidden revenue opportunities - discover which product elements catch attention and which get ignored, so you can optimize what matters
- Optimize your most valuable pages - understand how visitors actually interact with your best-selling product pages and checkout flow
- Make data-backed design decisions - stop guessing what works and start seeing exactly how customers use your store in real-time
- Fix mobile experience issues - identify touch and scroll patterns unique to mobile users that could be killing your conversions
- Bridge the gap Google Analytics can't fill - move beyond pageviews, bounce rates, and exit rates to see actual user behavior: where customer click, hover, scroll, and often get stuck
Read Next: How heatmap.com Generated $600,000 for a Client
So, what is the best heatmap for Shopify
The ideal heatmap tool for your Shopify store depends heavily on your specific needs and priorities. Here's a breakdown to help you decide:
- For Revenue-Driven Optimization: If your primary goal is to directly tie heatmap data to revenue and improve your conversion rate through data-backed decisions, heatmap.com stands out. Its unique ability to show revenue generated by specific page elements, combined with AI-driven detailed insights and A/B testing, makes it a powerful tool for serious e-commerce CRO.
- For Budget-Conscious Basic Heatmaps: If you're on a tight budget and need simple click and scroll tracking, Lucky Orange is a viable option. However, be aware of its limitations in data storage and potential impact on website speed.
- For General Customer Behavior and UX Analysis: If you prioritize understanding general user behavior and improving the overall user experience, tools like Hotjar, Mouseflow, and Smartlook offer a good balance of heatmaps, session recordings, and other UX analysis features. Hotjar offers a free plan, making it a good starting point.
- For In-Depth UX Research and Usability Testing: If you're conducting formal usability studies and need to combine heatmap data with other research methods like card sorting or tree testing, UXtweak is a strong choice.
- For a Comprehensive Website Optimization Suite: If you're looking for a tool that offers a wider range of website optimization features beyond heatmaps, including SEO analysis and website audits, Plerdy might be a good fit.
- For Real-time Analytics and Live Chat: If real-time insights and the ability to engage with visitors through live chat are crucial, Hitsteps offers a compelling combination of features.
In short:
- heatmap.com: Best for e-commerce businesses focused on revenue-driven CRO.
- Hotjar: Best for general UX analysis and those looking for a free starting point.
- Lucky Orange: Best for budget-conscious users needing basic heatmaps.
Consider your budget, the size of your Shopify store, your technical expertise, and the specific insights you're looking to gain when making your final decision. Taking advantage of free trials is highly recommended to test out different platforms and see which one best suits your workflow and needs.

Dylan AnderPublished February 25, 2025