ROAS Tracking in GA4: A Step-by-Step Guide to Measuring Campaign Success

Learn how to effectively track ROAS in GA4 with our comprehensive guide. Boost your marketing strategy today—read the article for expert insights!
Tracking return on ad spend (ROAS) is essential for optimizing marketing campaigns, but Google Analytics 4 doesn't make this easy. GA4 doesn't offer native ROAS tracking capabilities—it requires third-party tools, manual workarounds, and complex custom reports to calculate what should be a basic metric for marketers.
This comprehensive guide will walk you through:
- How to set up proper ROAS tracking in GA4 (including importing cost data from both Google and non-Google platforms)
- The critical limitations of GA4's ROAS capabilities that most marketers don't realize
- Practical solutions to overcome these limitations for accurate measurement of your advertising campaigns
P.S. We've tested all these methods using heatmapAI, which offers native ROAS tracking without the complex setup GA4 requires. If you want to skip the technical hurdles, heatmap provides real-time ROAS data without the 24-hour delay typical in GA4.
TL;DR
- GA4 cannot track ROAS natively – it requires third-party tools, manual cost imports, and complex custom reports to calculate what should be a basic metric
- Setting up proper ROAS tracking involves linking Google Ads, manually importing non-Google ad costs, configuring conversion events, and building custom reports
- Major GA4 limitations include data sampling issues, only two attribution models, and delayed reporting that prevents real-time optimization
- Consider alternatives like heatmapAI that offer real-time ROAS tracking, native ad platform integrations, and no custom code requirements
- Focus on segmenting your data by traffic source, device, and demographics to uncover hidden ROAS optimization opportunities
Understanding ROAS Tracking in GA4 vs. Universal Analytics
Google Analytics 4 represents a fundamental shift in how data is collected and analyzed compared to Universal Analytics. This shift significantly impacts how ROAS is tracked and calculated.
Event-Based vs. Session-Based Tracking
Universal Analytics used a session-based model where user interactions were grouped into sessions. GA4, however, uses an event-based model where every interaction is a standalone event.
How this affects ROAS tracking:
- Universal Analytics: ROAS was a built-in metric that automatically calculated return once cost data was imported
- GA4: ROAS must be manually calculated by creating custom metrics that divide ecommerce revenue by cost
This shift means marketers must now build their own ROAS reporting infrastructure within GA4, rather than relying on pre-built metrics.
Attribution Model Changes and Their Impact
GA4's attribution modeling also differs significantly from Universal Analytics:
The shift to data-driven attribution as the default in GA4 means ROAS calculations may show different results than in Universal Analytics—often attributing value to more touchpoints across the customer journey rather than just the last interaction.
Key Metrics and Dimensions for ROAS Analysis in GA4
To effectively analyze ROAS in GA4, you'll need to focus on these key metrics and dimensions:
Essential Metrics:
- Purchase revenue (from ecommerce events)
- Ad cost (imported from advertising platforms)
- Conversion events (form submissions, sign-ups, etc.)
- Conversion values (monetary value assigned to conversions)
Important Dimensions:
- Campaign ID (for matching cost data)
- Source/medium (traffic sources)
- Default channel grouping
- UTM parameters (campaign, content, term)
Warning: GA4 doesn't automatically connect these metrics and dimensions for ROAS calculation—you'll need to create custom reports to bring them together.
Step-by-Step Guide to Setting Up ROAS Tracking in GA4
Unlike dedicated analytics tools, GA4 has no built-in ROAS metric or reporting—you must manually import cost data, create custom calculations, and build reports from scratch to achieve what should be a standard marketing measurement.
Prerequisites for ROAS Tracking
Before diving into this complex ROAS configuration, ensure you have these foundations in place:
1. Creating a GA4 Property
If you haven't already set up GA4:
- Go to the Google Analytics admin panel
- Click "Create Property"
- Enter your property name, reporting time zone, and currency
- Complete the business information form
- Choose data collection platform: Web.
- Create a data stream for your website by adding your URL and stream name.

Pro Tip: Set your currency correctly during setup—it cannot be changed later and must match your cost data currency for accurate ROAS calculation.
2. Linking Google Ads Account to GA4
For Google Ads ROAS tracking:
- Navigate to Admin > Product Links > Google Ads linking
- Click "Link" and select the Google Ads account to connect
- Choose the GA4 property to link with
- Select data sharing options (all are recommended for ROAS tracking)
- Confirm the link configuration
Important: This linkage only imports Google Ads cost data. For other ad platforms, you must use GA4's Cost Data Import feature to upload cost data manually—a time-consuming process that must be repeated regularly.
3. Setting Up E-commerce Tracking
Proper revenue tracking is essential for ROAS calculation:
- Enable ecommerce data collection in your GA4 property settings
- Implement purchase event tracking on your website using either:
- Google Tag Manager
- GA4 ecommerce event code
- Verify that purchase events include these required parameters:
- value (total transaction amount)
- currency (transaction currency code)
- transaction_id (unique order identifier)
Common Issue: Many implementations fail to track revenue correctly because they miss the value parameter or implement it incorrectly. Always validate your setup with GA4 DebugView to ensure events fire properly and parameters are passed.
Configuring Conversion Events for ROAS Calculation
With the foundation in place, now configure your conversion events:
1. Defining Purchase Events
- In your GA4 property go to Admin > Data Display > Events
- Find your purchase event in the list
- Toggle the "Mark as key event" switch to ON
- Verify the event is triggering correctly using DebugView

Note: If you're tracking lead generation rather than direct purchases, mark your lead form submission events as conversions instead.
2. Setting Up Custom Parameters for Revenue Tracking
For non-ecommerce sites or to track micro-conversions:
- Create custom parameters for your conversion events
- Assign monetary values to each conversion type
- Use the GA4 Event Builder or gtag to add these parameters
Example for a newsletter signup worth $5:
gtag('event', 'sign_up', {
  'value': 5.00,
  'currency': 'USD'
});

3. Verifying Conversion Event Setup
Before proceeding, confirm your conversion tracking works:
- Use GA4 DebugView to test conversion events in real-time
- Check that value and currency parameters are correctly captured
- Verify events appear in the Conversions report
- Ensure currency formatting is consistent
Note: DebugView validates event firing and parameters but does not verify cost data import or ROAS accuracy.
Creating Custom ROAS Reports in GA4
Now for the crucial part—building ROAS reports that connect your revenue and cost data:
1. Using Exploration Reports
- Navigate to Explore > Start a new exploration
- Select "Free form" as your exploration type
- Add dimensions such as:
- Campaign (or other relevant dimensions)
- Date
- Add metrics such as:
- Purchase revenue
- Cost data (imported)
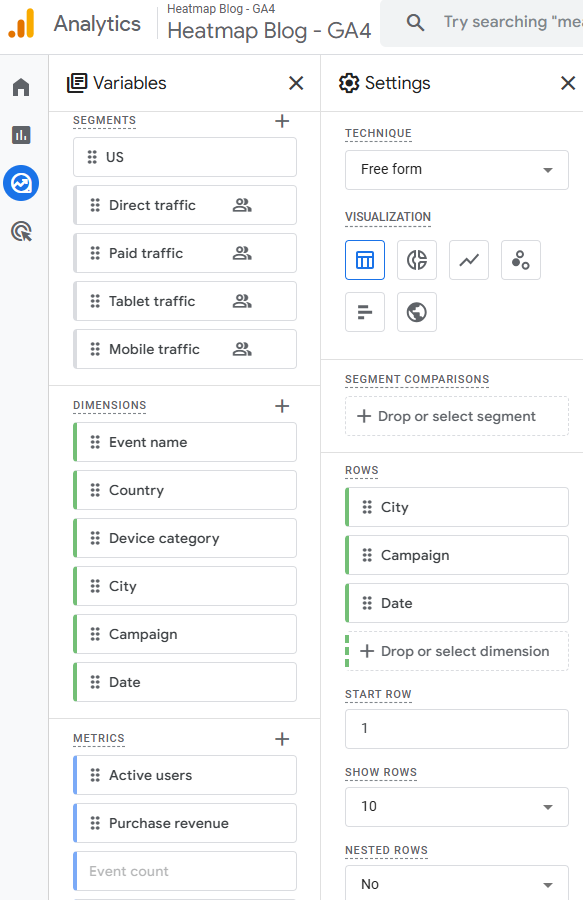
Note: The Cost metric only appears if cost data has been imported or linked to GA4.
- Create a calculated metric for ROAS:
- Click "+" next to Metrics
- Select "Create new metric"
- Enter formula: {{Purchase Revenue}} / {{Cost}}
- Name it "ROAS" and save
Pro Tip: Create multiple ROAS metrics with different formulas to account for various conversion types or calculate blended ROAS.
2. Setting Up Campaign Performance Dashboards
Create a comprehensive campaign dashboard:
- Start with a blank report in Explorations
- Add tabs for different advertising platforms
- Include visualizations for:
- ROAS by campaign
- ROAS trends over time
- Cost vs. Revenue comparison
- Conversion path analysis
3. Configuring ROAS Visualizations
Enhance your reports with effective visualizations:
- Use bar charts to compare ROAS across campaigns
- Create line charts to track ROAS trends over time
- Add tables with conditional formatting to highlight high/low performers
- Set up scorecards for at-a-glance ROAS monitoring
Example Table Configuration:
- Rows: Campaign
- Values: Cost, Revenue, ROAS
- Sort: ROAS (descending)
- Conditional formatting:
- Red for ROAS < 2
- Yellow for ROAS 2–4
- Green for ROAS > 4
While GA4 requires this complex, multi-step process just to calculate basic ROAS metrics, heatmapAI includes native ROAS tracking out-of-the-box. Marketers can view campaign performance immediately after installation without any custom configuration, manual data imports, or report building—saving hours of setup time and providing more reliable insights.

Common Challenges and Limitations of ROAS Tracking in GA4
The most fundamental limitation of GA4 is that it has no native ROAS tracking capability whatsoever. Unlike Universal Analytics or dedicated analytics platforms, GA4 forces marketers to cobble together a makeshift ROAS tracking system through manual imports, custom metrics, and exploration reports. Beyond this core deficiency, several other significant challenges complicate ROAS measurement in GA4.
Data Sampling Issues
GA4 uses data sampling for large datasets, which can significantly impact ROAS accuracy:
How Sampling Affects ROAS Accuracy
When GA4 samples data, it analyzes only a subset of your total data and extrapolates the results. This can lead to:
- Inconsistent ROAS calculations between reports
- Unreliable performance data for smaller campaigns
- Fluctuating metrics when changing date ranges
Identifying When Your Data is Being Sampled
GA4 doesn't clearly indicate when data is sampled in standard reports. However, in Exploration reports, look for:
- A yellow shield icon with a percentage
- Text indicating "This report is based on X% of sessions"
Workarounds for Data Sampling Problems
To minimize sampling impact on ROAS calculation:
- Reduce date ranges to analyze shorter periods
- Create separate GA4 properties for critical campaigns
- Use BigQuery export for unsampled data analysis
- Implement data-stream filters instead of report filters
Expert Tip: For high-spend campaigns where accuracy is crucial, consider exporting raw data to BigQuery for unsampled ROAS calculation.
Attribution Model Complications
GA4's limited attribution options create challenges for accurate ROAS measurement:
Understanding GA4's Attribution Models
GA4 offers only two attribution models:
- Data-driven attribution: Uses machine learning to distribute credit across touchpoints
- Last-click attribution: Gives 100% credit to the final interaction
This is a significant reduction from Universal Analytics' seven models.
How Different Models Affect ROAS Calculations
Your choice of attribution model dramatically impacts ROAS results:
Selecting the Right Attribution Model for Your Business
Consider these factors when choosing your GA4 attribution model:
- Sales cycle length: Longer cycles benefit from data-driven attribution
- Channel mix: Businesses with diverse channels need data-driven attribution
- Campaign objectives: Brand awareness campaigns need multi-touch attribution
- Decision complexity: High-consideration purchases require data-driven models
Warning: GA4's data-driven attribution requires sufficient data volume to work effectively. Small businesses may not meet the threshold, forcing reliance on last-click attribution.
Delayed Reporting and Its Impact
One of GA4's most frustrating limitations is its significant reporting delay:
GA4's 24-Hour Data Delay Explained
Unlike Universal Analytics, which processed data in near real-time, GA4:
- Processes most standard reports with a 24-48 hour delay
- Updates conversion data retrospectively as users complete journeys
- Finalizes attribution only after the attribution window closes
This means the ROAS you see today reflects campaign performance from 1-2 days ago—not current performance.
How Delayed Data Affects Campaign Optimization
This delay creates several challenges:
- Missed optimization opportunities: Cannot quickly identify and fix underperforming campaigns
- Slower reaction time: Competitors using real-time tools gain advantage
- Budget waste: Continued spending on ineffective campaigns during the delay period
- Reporting complications: Misaligned data between GA4 and ad platforms
Strategies to Mitigate the Impact of Delayed Reporting
To work around GA4's reporting delay:
- Use the GA4 DebugView for limited real-time monitoring
- Create a dual-reporting system with platform-native analytics
- Implement longer optimization cycles (weekly instead of daily)
- Use third-party tools for real-time ROAS monitoring
P.S. Unlike GA4, which has no native ROAS tracking capabilities, heatmapAI delivers built-in ROAS insights in real-time. This means marketers can identify and fix underperforming campaigns immediately instead of discovering problems days later after a significant marketing budget has already been wasted.

Best Practices for Monitoring Campaign Success with ROAS in GA4
Since GA4 does not offer native ROAS tracking, marketers must rely on imported cost data and custom reports. Despite this, you can still effectively monitor campaign performance by following these best practices.
Setting Realistic ROAS Targets
Establishing appropriate ROAS goals is essential for meaningful campaign evaluation:
Industry Benchmarks for ROAS
ROAS expectations vary significantly by industry:
Remember: These are averages—your specific benchmarks should account for your unique business model.
Factors Affecting ROAS Expectations
When setting targets, consider:
- Profit margins: Lower margins require higher ROAS to maintain profitability
- Customer lifetime value: Higher LTV justifies lower initial ROAS
- Campaign objectives: Awareness campaigns typically have lower ROAS than conversion campaigns
- Market maturity: Established markets generally have lower ROAS than emerging ones
- Competitive intensity: Higher competition typically drives down ROAS
How to Establish Appropriate ROAS Goals
Follow this process to set realistic targets:
- Calculate your break-even ROAS based on profit margins
- Analyze historical performance data
- Benchmark against industry standards
- Set tiered goals for different campaign types:
- Brand campaigns: Lower ROAS acceptable
- Retargeting: Expect higher ROAS
- Prospecting: Moderate ROAS targets
- Adjust targets based on seasonality and market conditions
Pro Tip: Rather than setting a single ROAS target, establish a minimum acceptable ROAS and a stretch goal to provide operational flexibility.
Segmenting Data for Deeper ROAS Insights
GA4's segmentation capabilities allow for more nuanced ROAS analysis:
Analyzing ROAS by Traffic Source
Create source-specific ROAS reports:
- In Explorations, add "Source/Medium" as a dimension
- Include metrics for cost, revenue, and ROAS
- Sort by ROAS to identify your most efficient traffic sources
- Create comparison visualizations to spot trends
This reveals which platforms deliver the best return—often contradicting assumptions about channel performance.
Breaking Down ROAS by Device Type
Device segmentation often reveals surprising ROAS variations:
- Add "Device category" as a dimension in your exploration
- Compare ROAS across desktop, mobile, and tablet
- Create device-specific segments for deeper analysis
- Look for device-specific conversion barriers
Example Finding: Many businesses discover that desktop ROAS significantly outperforms mobile, indicating potential mobile UX issues or checkout friction.
Examining ROAS Across Different Demographics
Demographic ROAS analysis helps refine targeting:
- Create segments based on age, gender, or location
- Compare ROAS across demographic groups
- Identify high-value audience segments
- Adjust campaign targeting based on findings
Warning: GA4's demographic data is limited and often incomplete due to privacy restrictions. Use this analysis as directional rather than definitive.
Integrating ROAS Data with Other Marketing Metrics
ROAS is most valuable when contextualized with complementary metrics:
Combining ROAS with Customer Lifetime Value
To understand true campaign profitability:
- Calculate average customer lifetime value (CLV) by acquisition source
- Create a custom metric: CLV-adjusted ROAS = (CLV × Conversion Rate × Number of Clicks) ÷ Ad Spend
- Use this to identify campaigns that may have lower initial ROAS but drive high-value customers
Example: A campaign with a 2:1 ROAS might seem underperforming until you discover its customers have 3× higher lifetime value than average.
Using ROAS Alongside Engagement Metrics
Enrich your ROAS analysis with engagement data:
- Add engagement metrics to your ROAS reports:
- Pages per session
- Average session duration
- Bounce rate
- Identify correlations between engagement and ROAS
- Use engagement metrics as leading indicators of future ROAS performance
Creating Holistic Campaign Performance Views
Build comprehensive dashboards that place ROAS in context:
- Create a multi-tab exploration with:
- ROAS overview
- Revenue contribution by channel
- Cost efficiency analysis
- Conversion path visualization
- Include both macro metrics (overall ROAS) and micro metrics (component parts)
- Add annotations for campaign changes, seasonality, and market events
P.S. heatmap's unique Revenue Per Session (RPS) metric complements ROAS by showing exactly how much revenue each page element generates, providing marketers with precise ROI analysis that GA4 simply cannot deliver.
Advanced ROAS Tracking Techniques in GA4
For marketers who need more sophisticated ROAS analysis, GA4 offers advanced capabilities through BigQuery integration and cross-platform tracking.
Using BigQuery for Enhanced ROAS Analysis
BigQuery unlocks GA4's full analytical potential for ROAS tracking:
Setting up GA4 Data Export to BigQuery
To enable this powerful integration:
- Create a Google Cloud Platform account and project
- Enable BigQuery API
- In GA4, go to Admin > Data Streams > Web
- Click on "BigQuery linking"
- Select your GCP project and region
- Choose data export frequency (daily recommended for ROAS analysis)
- Enable the data streams you want to export
Note: This feature requires GA4 360 (paid version) for daily exports. Standard GA4 only supports streaming exports.
Creating Custom ROAS Queries
With data in BigQuery, you can create sophisticated ROAS analyses:
SELECT
  traffic_source.source AS Source,
  traffic_source.medium AS Medium,
  traffic_source.campaign AS Campaign,
  SUM(ecommerce.purchase_revenue) AS Revenue,
  SUM(cost_data.cost) AS Cost,
  SAFE_DIVIDE(SUM(ecommerce.purchase_revenue), SUM(cost_data.cost)) AS ROAS
FROM
  `your_project.analytics_XXXXX.events_*`
WHERE
  _TABLE_SUFFIX BETWEEN '20230101' AND '20230131'
  AND event_name = 'purchase'
GROUP BY
  Source, Medium, Campaign
ORDER BY
  ROAS DESC
This query provides unsampled ROAS data by campaign, avoiding GA4's sampling limitations.
Visualizing ROAS Data with External Tools
Connect your BigQuery ROAS data to visualization platforms:
- Google Data Studio: Create interactive ROAS dashboards with direct BigQuery connection
- Tableau: Build advanced visualizations with drill-down capabilities
- Power BI: Develop comprehensive marketing analytics dashboards
- Python/R: Perform statistical analysis and predictive ROAS modeling
Expert Framework: Implement a multi-level ROAS analysis model:
- Level 1: Campaign-level ROAS (basic)
- Level 2: Segment-level ROAS (intermediate)
- Level 3: Customer journey ROAS (advanced)
- Level 4: Predictive ROAS modeling (expert)
Implementing Cross-Platform ROAS Tracking
Modern marketing requires tracking ROAS across multiple environments:
Tracking ROAS Across Web and App Environments
For businesses with both web and app presence:
- Set up GA4 app data streams alongside web streams
- Configure consistent event naming across platforms
- Implement user ID tracking for cross-platform user identification
- Create unified ROAS reports that combine web and app data
Challenge: Ensuring consistent parameter implementation across platforms is critical but technically complex.
Unifying ROAS Data from Multiple Sources
To create a complete ROAS picture:
- Implement consistent UTM parameters across all platforms
- Use campaign IDs as the primary key for cost data imports
- Create a data warehouse (BigQuery recommended) to consolidate:
- GA4 web data
- GA4 app data
- CRM data
- Ad platform data
- Call tracking data
- Build unified ROAS calculations in your data warehouse
Challenges in Cross-Platform Attribution
Be aware of these common cross-platform attribution issues:
- Device fragmentation: Users switch between devices during the purchase journey
- Cookie limitations: Privacy restrictions limit cross-domain tracking
- Platform silos: Each platform has its own attribution model
- Offline touchpoints: Many interactions occur outside digital tracking
Solution Framework: Implement a "data clean room" approach where first-party data from multiple sources can be securely combined while respecting privacy constraints.
Real-World Success: What Brands Can Achieve Superior ROAS Tracking
While understanding the technical aspects of ROAS tracking in GA4 is important, nothing illustrates the impact of proper analytics like real-world examples. Let's examine how actual brands have achieved measurable results with the right analytics approach.
JellyBee: Transforming Marketing Efficiency with Native ROAS Tracking
JellyBee, a supplements and wellness brand with a high repeat purchase rate, faced a common challenge: they needed to scale customer acquisition without sacrificing profitability.
The Challenge
Their marketing team needed to optimize their primary landing page to acquire as many new users as possible while maintaining ROAS targets:
- Limited visibility: Their listicle landing page showed concerning drop-off below the fold
- Optimization roadblocks: They lacked clear insights into which page elements were affecting conversion rates
- Scaling challenges: To grow aggressively, they needed to improve landing page performance without increasing ad costs
The Solution

JellyBee implemented heatmapAI to gain deeper insights:
- They used Heatmap's native ROAS tracking capabilities to understand campaign performance
- The platform's AI engine analyzed user behavior and recommended updating their hero image
- Based on demographic insights (middle-aged women being their target audience), they added a human element to their hero image—showing a woman holding the product instead of just the product alone

The Results
This seemingly simple change, driven by data insights from Heatmap's native ROAS tracking, delivered remarkable results:
- +24.7% Conversion Rate: The more relatable hero image connected better with their target audience
- +14.4% Revenue Per Session: Better engagement translated directly to higher revenue
- +31% ROAS: Their advertising efficiency improved dramatically
- $650,000+ in additional revenue: Generated within the first year
- Nearly 50x ROI: On their analytics investment in just the first 45 days

The key difference? heatmap's native ROAS tracking capabilities allowed JellyBee to identify exactly which elements affected revenue and make targeted improvements—without the complex configuration or technical hurdles typical of platforms like GA4.
Why Native ROAS Tracking Makes a Difference
JellyBee's success highlights why native ROAS tracking capabilities matter:
- Immediate insights: No reporting delays means faster optimization cycles
- Element-level revenue data: Understanding exactly which page elements drive conversions
- Direct platform connections: No manual cost data imports required
- Actionable recommendations: AI-powered suggestions based on actual user behavior
For brands serious about maximizing marketing efficiency, having a platform with native ROAS tracking capabilities isn't just convenient—it's a competitive advantage with measurable revenue impact.
Still Struggling with GA4's ROAS Limitations? heatmap's Native Tracking is the Answer
Let's be honest—tracking ROAS in GA4 is possible but painfully complex. Between manual cost imports, custom report building, and dealing with 24-hour data delays, you're spending more time configuring analytics than actually optimizing campaigns.
That's why so many marketers are turning to solutions like heatmapAI. Instead of wrestling with GA4's limitations, Heatmap gives you real-time ROAS data right out of the box. No custom code, no 24-hour delays, and no need for Google Tag Manager or Looker Studio just to see your basic ecommerce metrics.
Remember, perfect attribution isn't the goal—making better marketing decisions that drive revenue is. With the right approach to ROAS tracking like heatmapAI, you'll be well-equipped to do exactly that.
Try heatmap.com | Your eCommerce site will thank you (so will your wallet)
We are the only onsite analytics platform that tells you how to make more money - down to the pixel. Trusted by 1000+ eCommerce brands.

Ashvin Melwani
@ashvinmelwaniWith heatmap, I've been able to figure out what elements actually increase AOV and optimize our landing pages to drive more first purchase profitability, we're up 23% YoY.

Frequently Asked Questions About ROAS Tracking in GA4
Why is my ROAS data in GA4 different from my ad platform?
GA4 and ad platforms calculate ROAS differently due to:
- Attribution models: GA4 uses data-driven or last-click attribution, while ad platforms often use their own models
- Conversion windows: Different lookback periods between platforms
- Tracking methodology: GA4 is click-based while some platforms include view-through conversions
- Data processing: GA4's 24-hour delay versus real-time reporting in ad platforms
For the most accurate view, create a consistent measurement framework across all platforms.
How long does it take for ROAS data to appear in GA4?
ROAS data typically takes 24-48 hours to appear in GA4 due to:
- Processing delay: GA4 processes data in batches rather than real-time
- Attribution window: GA4 waits to attribute conversions across the customer journey
- Cost data import: Manual imports may add additional delays
To gain valuable insights faster, consider complementary tools that offer real-time ROAS reporting.
Can GA4 easily track ROAS from social media platforms?
Yes, but with limitations:
- Manual imports required: You must manually upload cost data from platforms like Facebook, Instagram, and TikTok
- UTM consistency crucial: Social campaigns must use consistent UTM parameters
- Attribution challenges: Social media's upper-funnel impact is often undervalued in GA4's attribution models
To improve social media ROAS tracking, implement consistent campaign tagging and consider supplementary analytics tools with native social platform integrations.
How accurate is ROAS tracking in GA4?
GA4's ROAS accuracy depends on several factors:
- Implementation quality: Proper event setup and cost data imports are essential
- Attribution model fit: How well GA4's models match your customer journey
- Data sampling: Large datasets may be sampled, reducing accuracy
- Cross-device tracking: Limited visibility into cross-device customer journeys
For businesses with complex customer journeys or high ad spend, supplementing GA4 with purpose-built ROAS tracking tools is often necessary for accurate measurement.
How You Can Do It:
1: Download heatmap
2: Wait for 5k sessions
3: Reorganize products based on the highest revenue per session from top left to bottom right.

Founder of heatmap, SplitTesting.com, and multiple ecommerce brands. Lifelong optimizer, CRO-lover, and data nerd.


You made it all the way down here?
Might as well give us a shot, right? It'll change the way you approach CRO. We promise. In fact, our friend Nate over at Original Grain used element-level revenue data from heatmap to identify high-impact areas of his website to test, resulting in a 17% lift in Revenue per Session while scaling site traffic by 43%. Be like Nate. Try heatmap today.
