How to Track Scroll Depth in GA4: The Complete Implementation Guide for 2025

Learn effective strategies for tracking scroll depth in GA4 to enhance user engagement. Discover actionable tips to optimize your analytics today!

Ever wondered if users are actually seeing your most important content? Scroll depth tracking reveals exactly how far visitors scroll on your website—but knowing where users drop off is only half the story. The real business impact comes from understanding how much revenue is lost when users abandon your pages.
In this comprehensive guide, you'll discover:
- Step-by-step methods to implement scroll depth tracking in GA4 (both native and custom approaches)
- How to analyze scroll data to identify UX improvements and content optimization opportunities
- Why revenue-based scroll tracking delivers superior business insights compared to standard engagement metrics
P.S. We tested all of these implementation methods using heatmapAI, which shows scroll-depth with revenue overlay rather than just empty engagement metrics. This approach transforms scroll tracking from a simple engagement metric into a powerful optimization tool.
Understanding GA4's Native Scroll Tracking Capabilities
Google Analytics 4 includes built-in scroll tracking through its Enhanced Measurement feature. While convenient, this native implementation has significant limitations you should understand before relying on it.
How GA4's Default Scroll Tracking Works
When Enhanced Measurement is enabled, GA4 automatically tracks a single scroll event when users reach approximately 90% of page depth. This means you'll only know if users reached near the bottom of your page—with no visibility into intermediate scroll points.
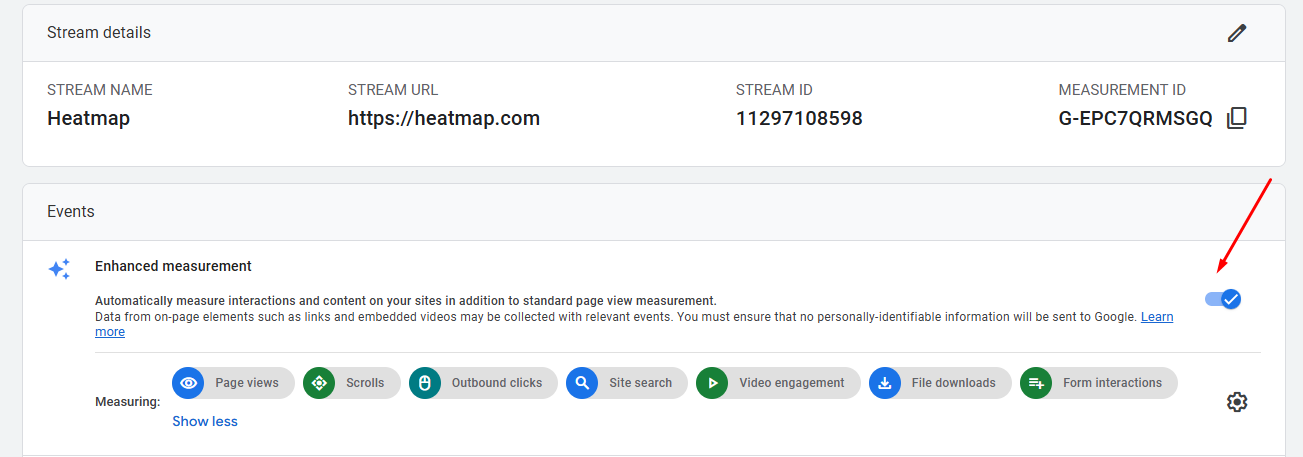
Here's how to check if Enhanced Measurement scroll tracking is enabled:
- In GA4, navigate to Admin > Data Streams
- Select your web data stream
- Click on the Enhanced Measurement settings icon
- Verify that the toggle for Scrolls is enabled
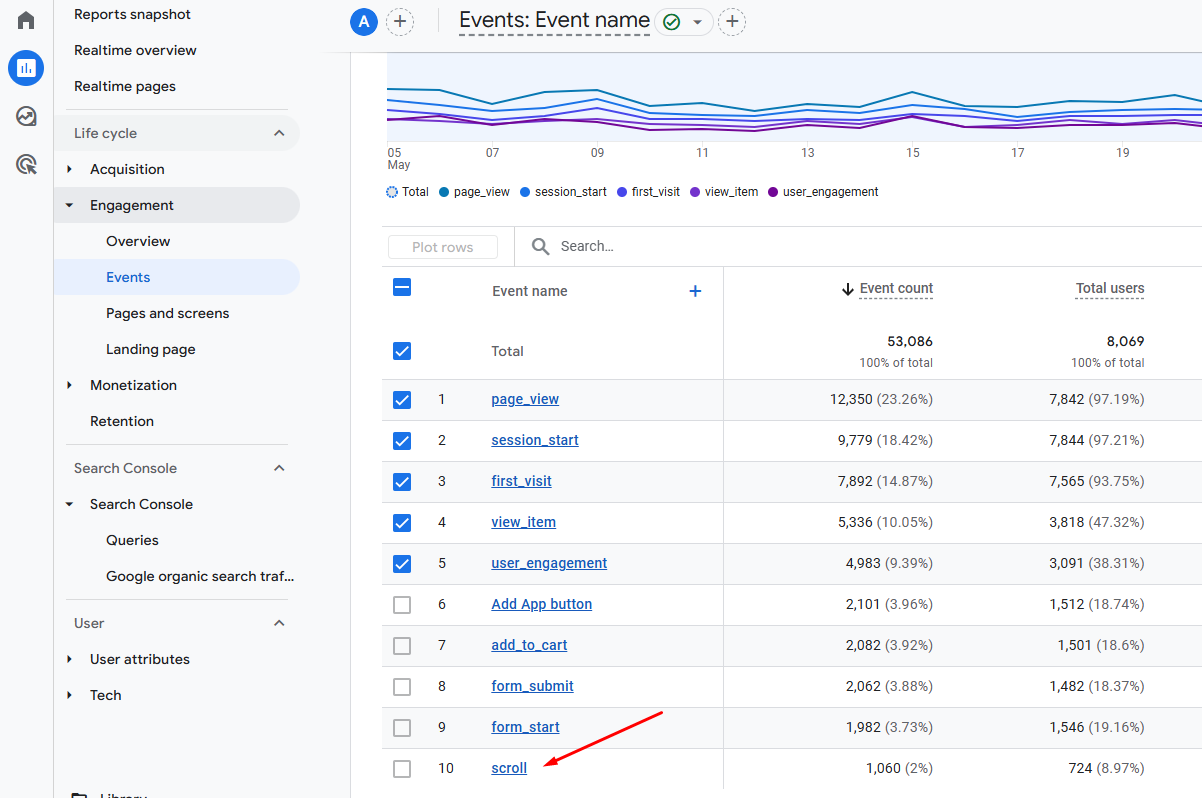
Accessing Default Scroll Data in GA4
To view the default scroll data in GA4:
- Navigate to Reports > Engagement > Events
- Look for the event named scroll
- Click on it to see details about which pages triggered scroll events
Limitations of GA4's Native Scroll Tracking
GA4's built-in scroll tracking has several significant drawbacks:
- Single threshold only - Only tracks the 90% scroll depth point, missing intermediate engagement data
- No customization - Can't adjust the scroll threshold percentage
- Limited context - Doesn't connect scroll behavior with other user actions
- No revenue correlation - Doesn't show how scroll behavior impacts conversions or revenue
- All-or-nothing approach - Either tracks at 90% or not at all
For most websites, knowing only if users reached 90% of the page provides incomplete data. You can't identify where users lose interest or which sections of your page perform best.
BTW, heatmap's scroll depth analysis shows exactly how far users scroll and correlates this directly with revenue. For example, if users who scroll past your product features section generate 3x more revenue than those who don't, you immediately know which content drives value.

Method 1: Implementing Custom Scroll Tracking Using Google Tag Manager
For more detailed scroll tracking, you'll need to implement a custom solution using Google Tag Manager (GTM). This approach allows you to track multiple scroll depth thresholds and collect more granular data about user engagement.
Step 1: Disable GA4's Native Scroll Tracking
First, you need to disable GA4's built-in scroll tracking to avoid duplicate events:
- In GA4, go to Admin > Data Streams
- Select your web data stream
- Click on the Enhanced Measurement settings icon
- Toggle off the Scrolls option
- Click Save
This step is crucial because running both native and custom scroll tracking simultaneously will result in duplicate data and skewed analytics.
Step 2: Setting Up Scroll Depth Variables in GTM
Next, you'll need to enable the built-in scroll variables in Google Tag Manager:
- In GTM, go to Variables > Configure
- In the Built-in Variables section, enable:
- Scroll Depth Threshold
- Scroll Depth Units
- Scroll Direction
These variables capture essential information about user scrolling behavior:
Step 3: Creating a Scroll Depth Trigger
Now, create a trigger that will fire when users reach specific scroll thresholds:
- In GTM, go to Triggers > New
- Name your trigger (e.g., "Scroll Depth Trigger")
- Choose Scroll Depth as the trigger type
- Select Vertical Scroll Depths
- Choose Percentages as the measurement method
- Enter your desired thresholds (e.g., 25, 50, 75, 90) separated by commas
- Select Page View as the condition to fire on
- Click Save
Best practices for threshold selection:
- Don't track too many thresholds - Each threshold creates an event, which counts against your GA4 event quota
- Focus on meaningful points - Choose thresholds that align with important content sections
- Consider page length - For very long pages, you might want additional thresholds (e.g., 10%, 25%, 50%, 75%, 90%)
- Test on mobile and desktop - Remember that scroll behavior varies significantly between devices
Step 4: Configuring the GA4 Event Tag
There are two main approaches to implementing scroll tracking in GA4. Let's explore both options:
Option 1: Single Event with Parameters
This approach sends a single event type with parameters indicating the scroll depth:
- In GTM, go to Tags > New
- Name your tag (e.g., "GA4 - Scroll Depth")
- Choose Google Analytics: GA4 Event as the tag type
- Add your GA4 Configuration tag
- Set the Event Name to "scroll"
- Add the following parameters:
- Name: percent_scrolled, Value: {{Scroll Depth Threshold}}
- Name: scroll_direction, Value: {{Scroll Direction}}
- Select your Scroll Depth Trigger
- Click Save
// Sample code for single event with parameters
gtag('event', 'scroll', {
  'percent_scrolled': 25, // Will be 25, 50, 75, etc. based on threshold reached
  'scroll_direction': 'vertical'
});

Option 2: Multiple Event Names
This approach creates distinct event names for each scroll threshold:
- In GTM, go to Tags > New
- Name your tag (e.g., "GA4 - Scroll Depth - Multiple Events")
- Choose Google Analytics: GA4 Event as the tag type
- Select your GA4 Configuration tag
- Set the Event Name to scroll_{{Scroll Depth Threshold}}
- Add the scroll depth parameter:
- Name: scroll_direction, Value: {{Scroll Direction}}
- Select your Scroll Depth Trigger
- Click Save
// Sample code for multiple event names
// This will create events like "scroll_25", "scroll_50", etc.
gtag('event', 'scroll_' + scrollDepthThreshold, {
  'scroll_direction': 'vertical'
});
Step 5: Testing and Troubleshooting
Before publishing your changes, test your implementation using GTM Preview mode:
- Click Preview in GTM
- Enter your website URL and click Start
- On your site, scroll to trigger the various thresholds
- In the GTM debug panel, verify that:
- The scroll trigger fires at each threshold
- The GA4 event tag fires correctly
- The parameters contain the expected values
Once your tags are firing correctly in Preview mode, check GA4's DebugView to ensure the events are being received:
- In GA4, go to Configure > DebugView
- Scroll on your landing page while DebugView is active
- Verify that scroll events appear with the correct parameters
Common issues and solutions:
BTW, heatmap’s scroll depth tracking works out of the box—no complex GTM setup required. It instantly shows where users drop off and overlays that behavior with revenue data, so you can identify which sections of your page drive sales and which ones lose customers. This makes it easy to prioritize changes that actually grow your bottom line.
Method 2: Implementing Scroll Tracking Directly with gtag.js
If you prefer not to use Google Tag Manager, you can implement scroll tracking directly with gtag.js. This method requires JavaScript knowledge but gives you complete control over the implementation.
Direct Implementation Steps
- First, ensure you have the GA4 gtag.js snippet installed on your site
- Add the following JavaScript code to your website:
// Wait for the DOM to be fully loaded
document.addEventListener('DOMContentLoaded', function() {
  // Define the scroll thresholds you want to track
  const scrollThresholds = [25, 50, 75, 90];
  let thresholdsReached = new Set();

  // Function to calculate scroll percentage
  function getScrollPercent() {
    const h = document.documentElement;
    const b = document.body;
    const st = 'scrollTop';
    const sh = 'scrollHeight';
    return (h[st]||b[st]) / ((h[sh]||b[sh]) - h.clientHeight) * 100;
  }

  // Function to check scroll thresholds and send events
  function checkScrollThresholds() {
    const scrollPercent = Math.round(getScrollPercent());

    scrollThresholds.forEach(threshold => {
      if (scrollPercent >= threshold && !thresholdsReached.has(threshold)) {
        // Mark this threshold as reached
        thresholdsReached.add(threshold);

        // Send event to GA4
        gtag('event', 'scroll', {
          'percent_scrolled': threshold,
          'page_path': window.location.pathname
        });

        console.log(`Scroll threshold ${threshold}% reached`);
      }
    });
  }

  // Add scroll event listener
  window.addEventListener('scroll', function() {
    // Use requestAnimationFrame for better performance
    window.requestAnimationFrame(checkScrollThresholds);
  }, { passive: true });
});
When to Use Direct Implementation vs. GTM
Direct implementation is best for:
- Developers comfortable with JavaScript
- Sites where GTM is not an option
- Situations requiring custom scroll behavior detection
- Performance-critical implementations
GTM implementation is best for:
- Marketing teams without developer resources
- Sites already using GTM for other tags
- Implementations that need frequent updates
- Scenarios where quick deployment is important
Analyzing Scroll Depth Data in GA4
Once you've implemented scroll depth tracking, you need to analyze the data to extract actionable insights.
Creating Custom Reports
GA4's standard reports don't provide detailed scroll analysis, so you'll need to create custom reports:
- In GA4, go to Explore > Create a new exploration
- Select the Free form exploration type
- In the Variables tab:
- Add Event name and Page path as dimensions
- Add Event count and Total users as metrics
- If using the single event approach, also add your custom parameter (e.g., percent_scrolled) as a dimension
- In the Tab settings, apply a filter where Event name equals "scroll" (or your custom event names)
- Drag Page path to rows and your scroll dimension to columns
- Drag Event count or Total users to values
This creates a report showing how many users reached each scroll threshold on each page.
Segmenting Users by Scroll Depth
To gain deeper insights, segment your users based on scroll behavior:
- Create a new segment in GA4
- Add a condition where Event name equals "scroll"
- Add another condition for the specific scroll depth you want to analyze
- Name your segment (e.g., "Deep Scrollers - 75%+")
- Apply this segment to your reports to compare behavior
This allows you to compare users who deeply engage with your content against those who don't.
Visualizing Scroll Data Effectively
The best way to visualize scroll data is with heatmaps or charts that show engagement drop-off:
- Export your data to a visualization tool like Google Data Studio
- Create a line chart showing the percentage of users reaching each scroll threshold
- Use a heatmap visualization to identify high and low engagement areas
- Compare scroll patterns across different devices and traffic sources
Look for sharp drops between thresholds, which indicate potential content or design issues that cause users to abandon the page.
Connecting Scroll Depth to Business Outcomes
The true value of scroll tracking comes from connecting this engagement data to business outcomes like conversions and revenue.
Correlating Scroll Depth with Conversions
To understand how scroll behavior impacts conversions:
- Create segments based on scroll depth (as described earlier)
- Compare conversion rates between these segments
- Analyze the path to conversion for users who reach different scroll depths
For example, you might discover that users who scroll past 75% of your product pages have a 3x higher conversion rate than those who don't.
Example Analysis Workflow
- Create segments for different scroll depths (e.g., <25%, 25-50%, 50-75%, >75%)
- Apply these segments to your conversion reports
- Compare conversion rates, average order value, and total revenue
- Identify the scroll depth in Google Analytics that correlates with higher conversion likelihood
This analysis helps you understand the relationship between content engagement and business results.
The Limitations of GA4's Scroll Tracking for Revenue Insights
While GA4's scroll tracking provides valuable engagement data, it has significant limitations when it comes to connecting scroll behavior to revenue:
- No direct revenue attribution - GA4 doesn't automatically connect scroll events to transaction data
- Manual analysis required - You must create custom segments and reports to link scroll behavior to revenue
- Limited visualization - No built-in way to visualize scroll depth alongside revenue metrics
- Delayed insights - Analysis requires multiple steps and is not available in real-time
- Aggregated data only - Can't see individual user journeys without complex setup
These limitations make it difficult to answer critical questions like:
- How much revenue is lost when users abandon a page at a specific scroll point?
- Which content sections drive the most revenue?
- How do scroll patterns differ between high-value and low-value customers?
The missing link between engagement and revenue is the ability to see exactly how scroll behavior impacts your bottom line in real-time, at a granular level.
Beyond GA4: Revenue-Based Scroll Depth Tracking with heatmapAI
Traditional scroll tracking tells you where users stop scrolling, but not how that impacts your business. Revenue-based scroll analytics bridges this gap by showing exactly how scroll behavior correlates with sales.
How Revenue-Based Scroll Tracking Works

heatmapAI's revenue-based scroll tracking combines scroll depth data with transaction information to create a complete picture of user engagement and its financial impact:
- Track scroll depth - Monitor how far users scroll on each page
- Capture revenue data - Record purchase amounts and transaction details
- Connect the dots - Link scroll behavior to subsequent purchases
- Visualize the relationship - Display scroll maps with revenue overlay
This approach transforms scroll tracking from a simple engagement metric into a powerful business optimization tool.
The Advantage of Revenue Overlay on Scroll Maps
With revenue overlay on scroll maps, you can:
- See revenue drop-off points - Identify exactly where high-value users abandon your pages
- Quantify content value - Measure the revenue impact of specific content sections
- Prioritize optimizations - Focus on fixing issues with the highest revenue potential
- Segment by value - Compare scroll behavior between high-value and low-value customers
- Measure ROI precisely - Calculate the exact revenue impact of scroll-related improvements
This data-driven approach ensures you optimize for business outcomes, not just engagement metrics.
How a 7-Figure DTC Brand Used Revenue-Based Scroll Tracking to Increase Conversion Rates
That Works Agency used heatmap's scroll-depth tracking to improve a UK fashion brand's collection pages with impressive results:
Challenge: The brand's filter was placed at the top of collection pages, which users often ignored until they scrolled back up, creating friction in the product discovery process.
Solution: Using heatmap's scroll-depth and session recordings, the agency discovered that the users who used the filter generated 3x more revenue than non-users. They made the filter larger and sticky, so it remained visible as users scrolled.
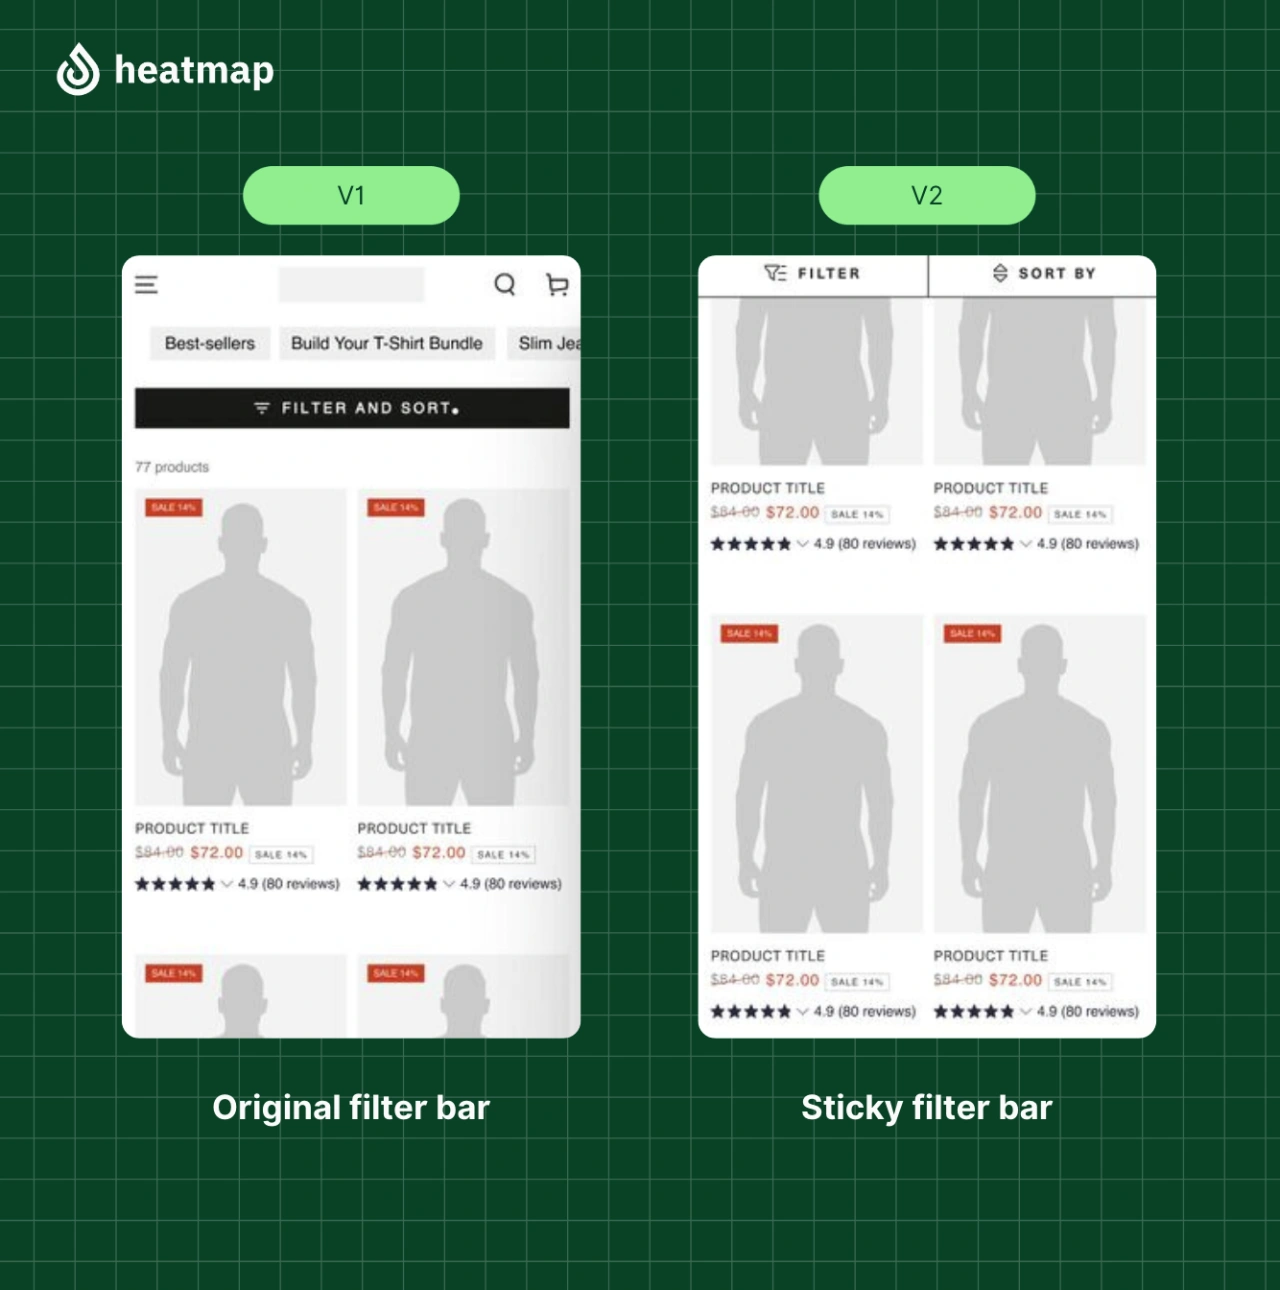
Results:
- +4.22% Conversion Rate
- +13.07% Revenue Per Session
- +14.19% Average Basket Size
- +34.48% increase in Filter Usage
- 13% overall revenue uplift
This case study demonstrates how revenue-based scroll insights can drive significant business improvements by focusing optimizations on what actually impacts sales.
Best Practices for Scroll Depth Implementation
To get the most value from scroll depth tracking, follow these best practices:
Choosing the Right Scroll Thresholds
- Align with content sections - Set thresholds that correspond to important content blocks
- Consider page length - Use more thresholds for longer pages (e.g., 10%, 25%, 50%, 75%, 90%)
- Focus on critical elements - Add specific thresholds at key CTAs or product information
- Limit total thresholds - Don't track too many points to avoid hitting GA4's event limits
Accounting for Different Device Types
Scroll behavior varies significantly between devices:
- Mobile users scroll more but engage less deeply
- Desktop users tend to read more thoroughly but may scroll less
- Tablet users fall somewhere in between
To account for these differences:
- Set up device-specific analysis in GA4
- Compare scroll patterns across devices
- Consider device-specific optimizations for critical pages
Avoiding Common Implementation Mistakes
Using Scroll Data to Improve Content and Layout
Once you have scroll data, put it to work:
- Restructure long pages - Move important content higher if users aren't scrolling far enough
- Add visual cues - Use design elements to encourage scrolling past common drop-off points
- Optimize CTAs - Reposition calls-to-action based on scroll patterns
- Improve content - Enhance sections where users tend to stop scrolling
- Test page variations - A/B test different layouts based on scroll insights
For example, if you notice users rarely scroll past 60% on mobile, consider moving key information above this threshold or adding visual elements to encourage deeper scrolling.
Beyond GA4: Transform Scroll Data into Revenue with HeatmapAI
Scroll depth tracking is powerful, but its true value comes from connecting this data to business outcomes.
Key Takeaways
- GA4's native tracking is severely limited - Only tracks at 90% depth, missing crucial engagement points
- Custom implementation provides more granular data - But requires technical setup and manual analysis
- Revenue-based scroll tracking reveals true business impact - See exactly where users drop off and how much revenue is lost
- Device-specific analysis is essential - Optimize for different scroll patterns across devices
heatmapAI's interactive scrollmaps show revenue drop-off points on each page, revealing not just where users stop scrolling, but the exact financial impact of each abandonment point. Unlike GA4's one-dimensional tracking, heatmapAI transforms scroll analysis from a simple engagement metric into a powerful revenue optimization tool—with no complex setup required.
Try heatmap.com | Your eCommerce site will thank you (so will your wallet)
We are the only onsite analytics platform that tells you how to make more money - down to the pixel. Trusted by 1000+ eCommerce brands.

Ashvin Melwani
@ashvinmelwaniWith heatmap, I've been able to figure out what elements actually increase AOV and optimize our landing pages to drive more first purchase profitability, we're up 23% YoY.

How You Can Do It:
1: Download heatmap
2: Wait for 5k sessions
3: Reorganize products based on the highest revenue per session from top left to bottom right.

Founder of heatmap, SplitTesting.com, and multiple ecommerce brands. Lifelong optimizer, CRO-lover, and data nerd.


You made it all the way down here?
Might as well give us a shot, right? It'll change the way you approach CRO. We promise. In fact, our friend Nate over at Original Grain used element-level revenue data from heatmap to identify high-impact areas of his website to test, resulting in a 17% lift in Revenue per Session while scaling site traffic by 43%. Be like Nate. Try heatmap today.
