GA4 Site Speed Insights: How to Track, Measure, and Improve Performance

Boost your site's performance with our GA4 site speed tips and best practices. Learn essential tracking techniques to enhance user experience. Read more!

Site speed isn't just a technical metric—it's directly tied to user experience, conversion rates, and even your search rankings. But here's the challenge: GA4 lacks the native site speed tracking capabilities that Universal Analytics offered.
This comprehensive guide will show you how to:
- Set up proper speed tracking in GA4 using custom implementations
- Interpret performance data to identify problem areas
- Implement actionable improvements to boost your site's speed and user experience
P.S. We tested all of these methods using heatmap's built-in site speed tracking, which provides immediate performance insights without any custom coding required. If you want to skip the technical setup and get straight to optimizing your site, it might be worth checking out.
TL;DR
- GA4 lacks native site speed reports that were available in Universal Analytics, requiring custom implementation through Google Tag Manager
- Core Web Vitals (LCP, FID/INP, CLS) are crucial metrics for measuring real user experience and SEO performance
- Custom implementation requires JavaScript variables, triggers, and event parameters in GTM, plus custom metrics in GA4
- Alternative tools like heatmap offer built-in site speed tracking with actionable insights tied directly to user behavior and revenue
Understanding Site Speed Metrics
Before diving into implementation, let's clarify the key metrics you should be tracking.
Core Web Vitals Explained
Core Web Vitals are Google's specific metrics for measuring user experience related to speed, responsiveness, and visual stability:
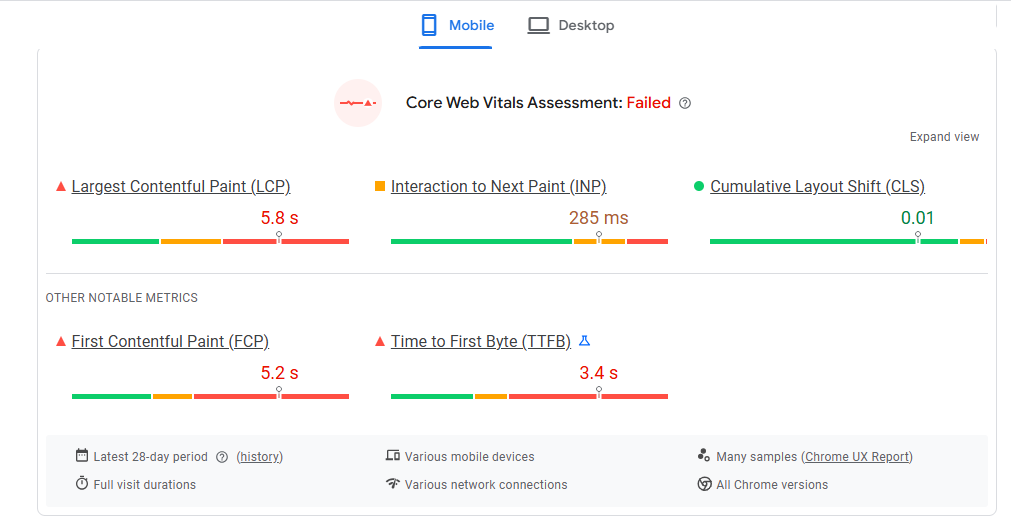
- Largest Contentful Paint (LCP): Measures loading performance—specifically, when the largest content element (usually an image or text block) becomes visible. For good user experience, LCP should occur within 2.5 seconds of page load.
- Interaction to Next Paint (INP): Measures overall responsiveness to user interactions throughout the page lifecycle. Good INP is less than 200 milliseconds.
- Cumulative Layout Shift (CLS): Measures visual stability—how much elements move around during page load. Good CLS is less than 0.1.
Additional Important Metrics
Beyond Core Web Vitals, these metrics provide valuable insights:
- Time to First Byte (TTFB): How long it takes for the browser to receive the first byte of response from the server. Good TTFB is less than 0.8 seconds.
- First Contentful Paint (FCP): When the first content (text, image, etc.) appears on screen. Good FCP is less than 1.8 seconds.
How These Metrics Impact User Experience and SEO
These page load time metrics directly correlate with how users perceive your site:
- Slow LCP = Users wonder if the site is working
- Poor FID/INP = Users think the site is broken or unresponsive
- High CLS = Users get frustrated by shifting content and accidental clicks
From an SEO perspective, Google explicitly uses Core Web Vitals as ranking signals. Sites with poor Core Web Vitals may see reduced visibility in search results, especially on mobile.
Setting Up Custom Site Speed Tracking in GA4
Despite the challenges, you can implement custom site speed tracking in Google Analytics using Google Tag Manager. Here's a step-by-step guide:
Step 1: Creating Custom JavaScript Code for Performance Metrics
First, you'll need to create a custom javascript variable that captures page load time in GA4:
- In Google Tag Manager, go to Variables → New
- Name it "Page Load Time" and select Custom JavaScript
- Add this code:
function() {
  if (window.performance && window.performance.getEntriesByType) {
    var entries = window.performance.getEntriesByType("navigation");
    if (entries.length > 0) {
      var navTiming = entries[0];
      var pageLoadTime = navTiming.loadEventEnd - navTiming.startTime;
      return Math.round(((pageLoadTime / 1000) + Number.EPSILON) * 100) / 100;
    }
  }
  return 0;
}

- Under "Format Value," enable "Convert undefined to" and set the value to 0
- Save the variable
This JavaScript uses the Performance Navigation Timing API to calculate how long the page takes to load, converting from milliseconds to seconds with two decimal places.
Step 2: Setting Up Triggers for Page Load Time Tracking
Next, create a trigger that fires when the page has fully loaded:
- Go to Triggers → New
- Name it "Page Load Time > 0"
- Choose Window Loaded as the trigger type
- Under "This trigger fires on," select Some Window Loaded Events
- Set the condition: Page Load Time is greater than 0
- Save the trigger
This ensures your tag only fires when there's a valid page load time to report.
Step 3: Creating GA4 Page Load Time Events
Now, create a load time event tag to send the page load time to Google Analytics:
- Go to Tags → New
- Name it "GA4 - Page Load Time"
- Choose Google Analytics: GA4 Event
- Enter your GA4 Tag
- Set the Event Name to "page_load_time"
- Add an event parameter:
- Name: loading_time_sec
- Value: Select your "Page Load Time" variable
- Under Triggering, select your "Page Load Time > 0" trigger
- Save the tag
Step 4: Registering Custom Parameters as Metrics in GA4
For GA4 to properly collect and report on your page load time data:
- In GA4, go to Admin → Custom Definitions → Custom Metrics
- Click Create Custom Metric
- Set the following:
- Metric Name: Page Load Time
- Description: Time in seconds to load the page
- Event Parameter: loading_time_sec
- Unit of Measurement: Second
- Click Save
This registers your custom parameter as a metric that can be used in load time reports.
Step 5: Validating Your Implementation with GA4 DebugView
Before publishing, validate that your implementation is working:
- In GTM, click Preview
- Enter your website URL
- Interact with your site and check that the "Page Load Time" tag fires
- In GA4, go to Configure → DebugView
- Verify that the "page_load_time" event appears with the correct parameter
Step 6: Creating Custom Reports in GA4 Explore
Finally, create a custom report to analyze your site speed data:
- In GA4, go to Explore
- Click the Blank template
- In Variables, add:
- Dimensions: Page path, Device category
- Metrics: Page Load Time (new custom metric)
- Create a table visualization showing average page load time by page and device
- Save your exploration
GA4's Site Speed Tracking Limitations
Before implementing custom tracking, it's important to understand GA4's limitations compared to Universal Analytics.
No Built-in Site Speed Reports
Unlike Universal Analytics, GA4 doesn't offer any native site speed reports. This means:
- No automatic collection of page load times
- No server response time metrics
- No built-in reports for speed analysis
- No speed suggestions
This fundamental gap forces website owners to create custom solutions or rely on third-party tools.
Limited Visualization Options
Even after implementing custom tracking (which we'll cover next), GA4's reporting capabilities for performance data are limited:
- No pre-built dashboards for speed metrics
- Limited options for time-series analysis
- Difficult to correlate speed with other metrics like bounce rate or conversion rate
- No built-in benchmarking against industry standards
Challenges with Data Sampling and Accuracy
GA4's data collection model presents additional challenges:
- Data sampling: Like Universal Analytics, GA4 may sample data for high-traffic sites, potentially making speed metrics less reliable
- Event-based model: GA4's event-based architecture doesn't naturally align with performance metrics
- Delayed reporting: There can be significant lag between data collection and availability in reports
- Limited historical data: Custom metrics only start collecting once implemented, with no historical data
Need for Custom Implementation via GTM
These limitations mean that tracking page load time and site speed in GA4 requires:
- Custom JavaScript implementation
- Google Tag Manager configuration
- Custom metrics setup in GA4
- Custom report creation
Unlike GA4's technical barriers, heatmapAI includes built-in site speed tracking with actionable recommendations to resolve issues quickly. This helps your site run faster and improves both user engagement and conversion rates without requiring complex custom implementations.
Alternative #1: Using the Core Web Vitals Library with GA4
For more comprehensive performance tracking, you can implement Google's web-vitals JavaScript library to track Core Web Vitals in GA4.
Implementing the Web-Vitals JavaScript Library
The web-vitals library provides a standardized way to measure Core Web Vitals metrics. Here's how to implement it:
- Create a new Custom HTML tag in GTM
- Add this code:
<script>
(function() {
  // Load the web-vitals library
  var script = document.createElement('script');
  script.src = 'https://unpkg.com/web-vitals@2.1.4/dist/web-vitals.iife.js';
  script.async = true;

  script.onload = function() {
    // When the library loads, measure the Core Web Vitals
    webVitals.getLCP(sendToGA);
    webVitals.getFID(sendToGA);
    webVitals.getCLS(sendToGA);

    // Optional: track additional metrics
    webVitals.getFCP(sendToGA);
    webVitals.getTTFB(sendToGA);
  };

  // Function to send the metrics to GA4
  function sendToGA(metric) {
    // Push the data to the dataLayer
    window.dataLayer = window.dataLayer || [];
    window.dataLayer.push({
      event: 'web-vitals',
      event_category: 'Web Vitals',
      event_action: metric.name,
      event_value: Math.round(metric.value * 100) / 100,
      event_label: metric.id,
      non_interaction: true
    });
  }

  document.head.appendChild(script);
})();
</script>
- Set the trigger to All Pages
- Save the tag
Sending Core Web Vitals Data to GA4
Next, create a trigger and tag to send these metrics to GA4:
- Create a new Custom Event trigger:
- Event name: web-vitals
- Save the trigger
- Create a new GA4 Event tag:
- Event name: {{DLV - event_action}} (create this data layer variable first)
- Parameters:
- metric_name: {{DLV - event_action}}
- metric_value: {{DLV - event_value}}
- metric_id: {{DLV - event_label}}
- Triggering: Your web-vitals custom event trigger
- Save the tag
Setting Up Custom Dimensions and Metrics
In GA4, register these parameters as custom metrics:
- Go to Admin → Custom Definitions → Custom Metrics
- Create custom metrics for each Core Web Vital:
- LCP (Largest Contentful Paint): Unit = Second
- FID (First Input Delay): Unit = Millisecond
- CLS (Cumulative Layout Shift): Unit = None
Creating Dashboards for Core Web Vitals in GA4
Create a comprehensive Core Web Vitals dashboard:
- In Explore, start with a Blank exploration
- Add dimensions: Page path, Device category
- Add metrics: Your custom Core Web Vitals metrics
- Create visualizations:
- Table showing average metrics by page
- Time series showing trends over time
- Bar charts comparing performance across devices
Alternative #2: Leveraging Complementary Tools
While custom GA4 implementations provide valuable data, they require significant technical effort and maintenance. Several complementary tools offer more streamlined approaches to performance monitoring.
heatmap's Built-in Site Speed Tracking
Heatmap provides immediate site speed insights without custom coding:
- Immediate site speed insights without custom coding: Unlike GA4's complex setup requirements, heatmap provides immediate site speed insights without custom coding. Installation takes just minutes—simply add a single script to your site, and you'll start collecting performance data right away.
- Identify JavaScript errors affecting performance: heatmap's built-in JavaScript error tracking identifies specific code issues that impact performance. This feature automatically detects errors that might be slowing down your site and provides actionable recommendations to fix them.

- Actionable recommendations to improve speed based on real user data: heatmap provides actionable recommendations to resolve issues quickly. These targeted suggestions identify specific opportunities to reduce load times, eliminate performance bottlenecks, and enhance how users interact with your site.
Google PageSpeed Insights and Lighthouse

Google offers free tools for performance analysis:
PageSpeed Insights combines lab and field data to provide:
- Performance scores for both mobile and desktop
- Core Web Vitals measurements
- Specific optimization recommendations
- Historical performance data
Lighthouse (available in Chrome DevTools) provides:
- Detailed performance audits
- Specific recommendations with priority levels
- Simulated testing in various network conditions
- Performance scoring across multiple categories
These tools are excellent for identifying specific technical issues but lack the user behavior context that Heatmap provides.
GTMetrix

GTMetrix offers comprehensive performance testing and monitoring:
- Detailed performance reports with scores and metrics from both PageSpeed and YSlow
- Historical tracking to monitor performance changes over time
- Multiple test locations to evaluate global performance
- Video playback showing exactly how your page loads
- Waterfall analysis identifying which resources slow down your page
This tool provides actionable insights into specific elements causing performance issues.
Analyzing Site Speed Data for Actionable Insights
Once you've implemented tracking, the next step is turning that data into actionable insights.
Identifying Problem Pages and Elements
Start by identifying your worst-performing pages:
- In your GA4 custom report or Heatmap dashboard, sort pages by load time or Core Web Vitals metrics
- Look for patterns among slow pages:
- Do they share similar templates?
- Do they contain similar elements (large images, videos, etc.)?
- Are they managed by the same team?
Next, use tools like Heatmap's scrollmaps to see where users abandon slow pages, helping you prioritize which elements to optimize first.
Segmenting by Device Type, Browser, and Connection Speed
Performance varies significantly across devices and networks:
- Segment your performance data by:
- Device category (desktop, tablet, mobile)
- Browser type (Chrome browser, Edge, Mozilla Firefox)
- Connection speed (when available)
- Geographic location
- Look for specific issues affecting particular segments:
- Mobile-specific layout issues causing CLS
- Browser-specific JavaScript problems
- Regional performance issues that might indicate CDN gaps
This segmentation helps you prioritize fixes that will impact the most users.
Correlating Speed Metrics with Conversion Rates and Bounce Rates
The true value of speed data comes from connecting it to business metrics:
- Compare performance metrics with:
- Conversion rates
- Bounce rates
- Average session duration
- Pages per session
- Calculate the potential revenue impact of speed improvements:
- If improving LCP by 1 second correlates with a 5% conversion increase
- And your average order value is $75
- Then for 10,000 monthly visitors, that improvement could mean an additional $37,500 in monthly revenue
Heatmap automates this analysis, directly showing how speed impacts revenue per session across different user segments.
Setting Up Alerts for Performance Degradation
Proactive monitoring prevents performance issues from impacting users:
- Set up alerts for sudden changes in:
- Page load time
- Core Web Vitals metrics
- JavaScript errors
- Server response time
- Configure notifications via:
- Slack
- SMS for critical issues
Heatmap's proactive monitoring automatically alerts you to performance issues before they significantly impact your business, unlike GA4 which requires manual checking.
Best Practices for Improving Site Speed
Based on your analysis, implement these proven optimization strategies to improve performance.
Image Optimization Techniques
Images often account for the largest portion of page weight:
- Format selection: Use next-gen formats like WebP and AVIF (with fallbacks for older browsers)
- Responsive images: Implement srcset and sizes attributes to serve appropriate image sizes
- Compression: Apply lossy or lossless compression depending on image type
- Lazy loading: Add loading="lazy" to images below the fold (but not to LCP images)
- Image CDN: Consider services like Cloudinary or Imgix that optimize images on-the-fly
Example implementation:
<img
  src="small.jpg"
  srcset="small.jpg 400w, medium.jpg 800w, large.jpg 1200w"
  sizes="(max-width: 600px) 400px, (max-width: 1200px) 800px, 1200px"
  width="800"
  height="600"
  alt="Optimized responsive image"
  loading="lazy">
JavaScript and CSS Optimization
Render-blocking resources significantly impact average page loading time:
- Code splitting: Break JavaScript into smaller chunks loaded only when needed
- Tree shaking: Remove unused code from your bundles
- Minification: Reduce file size by removing whitespace and shortening variable names
- Critical CSS: Inline critical styles and defer non-critical CSS
- Async/defer: Use async or defer attributes on non-critical scripts
Example implementation:
<!-- Critical CSS inline -->
<style>
  /* Critical styles here */
</style>

<!-- Defer non-critical CSS -->
<link rel="preload" href="styles.css" as="style" onload="this.onload=null;this.rel='stylesheet'">
<noscript><link rel="stylesheet" href="styles.css"></noscript>

<!-- Defer non-critical JavaScript -->
<script src="app.js" defer></script>
Server Response Time Improvements
A fast TTFB (Time To First Byte) is essential for good performance:
- Server optimization: Tune web server configuration (Apache, Nginx, etc.)
- Database optimization: Index frequently queried tables and optimize queries
- Caching: Implement server-side caching for dynamic content
- CDN: Use a Content Delivery Network to serve content from edge locations
- Hosting upgrade: Consider upgrading to a more powerful hosting solution
P.S., Heatmap's site speed tracking automatically monitors server response time and provides specific recommendations for improvement based on your actual server performance.
Implementing Effective Caching Strategies
Proper caching dramatically improves repeat visits:
- Browser caching: Set appropriate Cache-Control and Expires headers
- Service Workers: Implement a service worker for offline functionality
- CDN caching: Configure your CDN's caching rules for optimal performance
- Application caching: Cache API responses and database queries
Example implementation:
# Apache .htaccess example
<IfModule mod_expires.c>
  ExpiresActive On
  ExpiresByType image/jpeg "access plus 1 year"
  ExpiresByType image/png "access plus 1 year"
  ExpiresByType text/css "access plus 1 month"
  ExpiresByType application/javascript "access plus 1 month"
</IfModule>
Mobile Optimization Considerations
With mobile-first indexing, mobile performance is particularly important:
- Responsive design: Ensure your site works well across all device sizes
- Touch optimization: Make tap targets at least 48px × 48px
- Viewport configuration: Set appropriate viewport meta tags
- Mobile-specific optimizations: Consider serving simplified content to mobile users
- AMP: Consider Accelerated Mobile Pages for content-focused sites
Advanced Site Speed Optimization Techniques
For sites already implementing basic optimizations, these advanced techniques can further improve performance.
Implementing Lazy Loading for Images and Videos
Lazy loading defers loading off-screen resources:
- Native lazy loading: Use the loading="lazy" attribute for images and iframes
- Intersection Observer: Implement custom lazy loading for broader browser support
- Video optimization: Use thumbnails instead of loading video players immediately
Example implementation:
// Custom lazy loading with Intersection Observer
document.addEventListener("DOMContentLoaded", function() {
  var lazyImages = [].slice.call(document.querySelectorAll("img.lazy"));

  if ("IntersectionObserver" in window) {
    let lazyImageObserver = new IntersectionObserver(function(entries, observer) {
      entries.forEach(function(entry) {
        if (entry.isIntersecting) {
          let lazyImage = entry.target;
          lazyImage.src = lazyImage.dataset.src;
          lazyImage.classList.remove("lazy");
          lazyImageObserver.unobserve(lazyImage);
        }
      });
    });

    lazyImages.forEach(function(lazyImage) {
      lazyImageObserver.observe(lazyImage);
    });
  }
});
Using Content Delivery Networks (CDNs)
CDNs distribute your content globally for faster delivery:
- Static asset CDN: Serve images, CSS, and JavaScript from a CDN
- Full-site CDN: Route all traffic through a CDN for optimization
- Video CDN: Use specialized services for video content
- Multi-CDN strategy: Use multiple CDNs for redundancy and optimal performance
Popular options include Cloudflare, Fastly, and Akamai, each offering different features and pricing models.
Optimizing Third-Party Scripts and Tags
Third-party scripts often cause significant performance issues:
- Audit third-party code: Identify and remove unnecessary scripts
- Self-host third-party resources when possible
- Implement tag management: Use Google Tag Manager to control script loading
- Delay non-critical scripts: Load analytics and marketing tags after critical content
Example implementation:
<!-- Delay third-party script loading -->
<script>
  window.addEventListener('load', function() {
    setTimeout(function() {
      var script = document.createElement('script');
      script.src = 'https://third-party-analytics.com/script.js';
      document.body.appendChild(script);
    }, 2000);
  });
</script>
Implementing Critical CSS
Critical CSS improves perceived performance by inlining styles needed for above-the-fold content:
- Identify CSS required for above-the-fold content
- Inline this CSS in the <head> of your document
- Load the full CSS asynchronously
Tools like Critical, CriticalCSS, and Penthouse can automatically extract critical CSS.
Reducing JavaScript Execution Time
Heavy JavaScript execution blocks the main thread and impacts interactivity:
- Code splitting: Break JavaScript into smaller chunks
- Web Workers: Move non-UI work to background threads
- Optimize event handlers: Debounce or throttle frequent events
- Virtualize long lists: Render only visible items in long scrollable lists
Example implementation:
// Debounce function to limit execution frequency
function debounce(func, wait) {
  let timeout;
  return function() {
    clearTimeout(timeout);
    timeout = setTimeout(() => func.apply(this, arguments), wait);
  };
}

// Usage
window.addEventListener('resize', debounce(function() {
  // Handle resize event
}, 150));
Measuring Impact: Before and After Analysis
To demonstrate the value of your optimizations, conduct thorough before-and-after analysis.
Setting Up Benchmarks Before Optimization
Before making changes, establish baseline metrics:
- Record current performance metrics:
- Core Web Vitals
- Page load time
- TTFB
- JavaScript execution time
- Document business metrics:
- Conversion rates
- Bounce rates
- Average session duration
- Revenue per session
- Create benchmarks for different segments:
- Device types
- Connection speeds
- Geographic regions
Tracking Improvements Over Time
After implementing optimizations:
- Monitor performance trends over time
- Compare against your baseline metrics
- Document specific improvements:
- "LCP improved by 35% on mobile devices"
- "CLS reduced from 0.25 to 0.08 on product pages"
heatmap's comparison mode makes this process simple by allowing you to compare performance before and after changes across different user segments.
Correlating Page Speed Improvements with Business Metrics
Connect technical improvements to business outcomes:
- Calculate the impact on:
- Conversion rate changes
- Revenue increases
- Bounce rate reductions
- User engagement metrics
- Estimate ROI of optimization efforts:
- Implementation costs vs. revenue gains
- Long-term benefits of improved search engine results
Turn Site Speed Data Into Actionable Improvements with heatmapAI
After exploring GA4's site speed tracking limitations, it's clear that monitoring performance requires either significant technical expertise or the right tools.
heatmap offers a refreshingly simple alternative with built-in site speed tracking that works immediately upon installation. Unlike GA4's complex custom implementation, heatmap provides actionable recommendations to improve load times and enhance the overall user experience—without requiring you to analyze complex performance data.
By identifying specific opportunities to reduce loading delays and eliminate performance bottlenecks, Heatmap helps you prioritize the speed improvements that will have the most significant impact on both engagement metrics and conversion rates.
Try heatmap.com | Your eCommerce site will thank you (so will your wallet)
We are the only onsite analytics platform that tells you how to make more money - down to the pixel. Trusted by 1000+ eCommerce brands.

Ashvin Melwani
@ashvinmelwaniWith heatmap, I've been able to figure out what elements actually increase AOV and optimize our landing pages to drive more first purchase profitability, we're up 23% YoY.

How You Can Do It:
1: Download heatmap
2: Wait for 5k sessions
3: Reorganize products based on the highest revenue per session from top left to bottom right.

Founder of heatmap, SplitTesting.com, and multiple ecommerce brands. Lifelong optimizer, CRO-lover, and data nerd.


You made it all the way down here?
Might as well give us a shot, right? It'll change the way you approach CRO. We promise. In fact, our friend Nate over at Original Grain used element-level revenue data from heatmap to identify high-impact areas of his website to test, resulting in a 17% lift in Revenue per Session while scaling site traffic by 43%. Be like Nate. Try heatmap today.
