GA4 Revenue Tracking: Key Steps to Track and Analyze Your Sales Data

Master GA4 revenue tracking by addressing missing data issues. Get actionable tips and insights to enhance your analytics. Read the guide now!
Ever wondered why your Google Analytics dashboard shows revenue figures that don't match your actual sales? Or why setting up proper revenue tracking feels like you need an engineering degree?
Revenue tracking in GA4 isn't just complex—it's a minefield of technical requirements that can lead to inaccurate data and misguided business decisions. The difference between properly configured tracking and basic setup can mean the difference between growth-driving insights and misleading numbers.
In this guide, you'll discover:
- How to properly set up GA4 revenue tracking (without the usual headaches)
- The essential parameters and events required for accurate sales data
- Why many businesses struggle with GA4's complex requirements (and a simpler alternative)
P.S., We've tested all these configuration challenges using heatmapAI, which offers real-time, accurate revenue tracking without the complex setup GA4 requires. If you want to skip the technical hurdles, heatmap might be worth considering.
TL;DR
- GA4 revenue tracking requires specific event implementation - The purchase event must include both event-level parameters (transaction_id, value, currency) and item-level details in an items array
- Setup takes significant technical resources - Expect 20-40 hours of developer time (~$3-5k cost) for proper GA4 revenue tracking configuration
- Data accuracy issues are common - GA4 typically reports 15-20% higher revenue figures than actual cash collected by tracking gross sales without accounting for discounts
- Real-time analysis is impossible - GA4's 24-hour reporting delay prevents immediate action on revenue issues or opportunities
- Alternatives exist - Tools like Heatmap provide out-of-the-box revenue tracking without custom code requirements
Understanding GA4 Revenue Tracking Fundamentals
Before diving into the technical setup, it's important to understand what makes GA4 revenue tracking different from its predecessor and why getting it right matters so much for your business decisions.
How GA4 Revenue Tracking Differs from Universal Analytics
GA4 represents a fundamental shift in how Google Analytics processes and reports your sales data. This isn't just a UI update—it's a complete overhaul of the tracking model.
Event-based vs. session-based tracking:
- Universal Analytics focused on sessions and pageviews
- GA4 centers everything around events and parameters
- Every user interaction (including purchases) is an event with specific parameters
Key differences in metrics and reporting:
- Universal Analytics had pre-built ecommerce reports with familiar metrics
- GA4 requires custom exploration reports for many previously standard metrics
- Transaction data is structured differently, with event-level and item-level parameters
Migration challenges:
- Many businesses find their revenue numbers don't match after migration
- Custom implementation is required for metrics that were automatic in UA
- Data sampling issues can affect large ecommerce sites
The shift to GA4's event-based model means that revenue tracking now requires explicit configuration of purchase events with specific parameters. Without proper setup, your revenue data will be incomplete or entirely missing.
Essential Revenue Metrics in GA4
GA4 tracks several key revenue metrics that help you understand your sales performance. Understanding these metrics is crucial for proper analysis:
Purchase Revenue:
- The total revenue from purchase events
- Includes tax and shipping by default
- Requires the "value" parameter in purchase events
Total Revenue:
- Combines purchase revenue with other revenue events
- May include refunds (as negative values) if properly tracked
- Provides a complete picture of all revenue streams
Gross Purchase Revenue:
- Revenue before any refunds are applied
- Helps understand initial sales performance
- Important for comparing with platform data
Average Order Value:
- Calculated as purchase revenue divided by number of transactions
- Key indicator of customer spending habits
- Useful for evaluating product bundling or pricing strategies
Item Revenue:
- Revenue attributed to specific products
- Requires proper item-level parameters in the purchase event
- Essential for product performance analysis
Other key ecommerce KPIs:
- Conversion rate (purchases divided by sessions)
- Add-to-cart rate
- Cart abandonment rate
- Product list click-through rate
Understanding these metrics is only half the battle—configuring GA4 to accurately collect this data is where many businesses struggle.
P.S., While GA4 offers these metrics, many businesses struggle with the 24-hour data delay when trying to make quick revenue-impacting decisions. Tools like heatmapAI provide real-time revenue data, allowing teams to identify and fix issues immediately rather than discovering problems a day later.

Step-by-Step GA4 Revenue Tracking Setup Guide
Setting up GA4 revenue tracking requires careful configuration across multiple systems. Follow these steps to ensure accurate data collection.
Step 1: Configure Your GA4 Property for Ecommerce
Before diving into specific event tracking, you need to set up your GA4 property correctly:
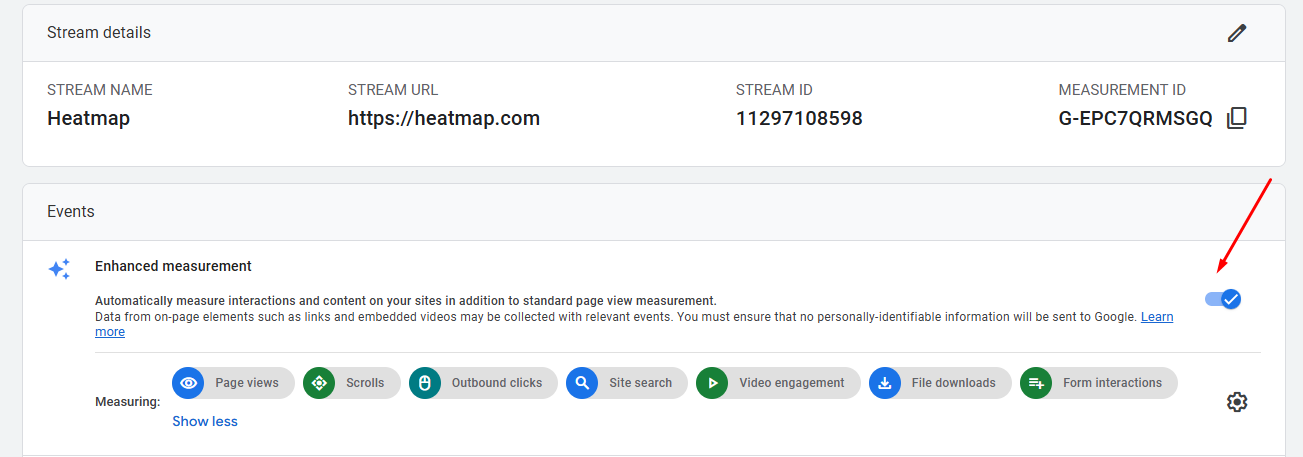
Enabling Enhanced Measurement:
- Go to Admin > Data Streams > Select your web data stream
- Ensure Enhanced Measurement is toggled on
- Verify that "Outbound clicks," "Site search," and "Page views" are enabled
Setting up data streams:
- Create a separate data stream for each website or app
- For websites, add your domain and configure stream settings
- Note your Measurement ID (G-XXXXXXXX) for implementation

Verifying property settings:
- Under Admin > Property Settings, confirm currency and time zone settings
- Ensure these match your ecommerce platform settings
- Check that data retention settings meet your analysis needs (recommend maximum 14 months)
These foundational settings ensure that your GA4 property is ready to receive and process ecommerce data correctly.
Step 2: Implement the Purchase Event with Required Parameters
The purchase event is the cornerstone of revenue tracking in GA4. It must include specific parameters to accurately capture sales data:
transaction_id:
- A unique identifier for each transaction
- Critical for deduplication (GA4 deduplicates by user + transaction_id)
- Example: 'transaction_id': 'T_12345'
value:
- The total revenue amount for the transaction
- Must be a numeric value (no currency symbols)
- Example: 'value': 49.99
currency:
- The currency code for the transaction
- Uses ISO 4217 format (USD, EUR, GBP, etc.)
- Example: 'currency': 'USD'
items array:
- Contains details about each product in the transaction
- Each item requires specific parameters:
- item_id: Product SKU or unique identifier
- item_name: Product name
- price: Individual product price
- quantity: Number of units purchased
Code example for implementation:
// Example purchase event implementation
dataLayer.push({ ecommerce: null });  // Clear previous ecommerce object
dataLayer.push({
  event: 'purchase',
  ecommerce: {
    transaction_id: 'T_12345',
    value: 49.99,
    tax: 4.90,
    shipping: 5.99,
    currency: 'USD',
    items: [{
      item_id: 'SKU_123',
      item_name: 'Premium Widget',
      price: 19.99,
      quantity: 2,
      item_category: 'Widgets'
    },
    {
      item_id: 'SKU_456',
      item_name: 'Deluxe Gadget',
      price: 10.01,
      quantity: 1,
      item_category: 'Gadgets'
    }]
  }
});

This code should be triggered when a purchase is completed, typically on the order confirmation page.
Step 3: Set Up Google Tag Manager for GA4 Ecommerce
Google Tag Manager (GTM) makes implementing GA4 ecommerce events more manageable:
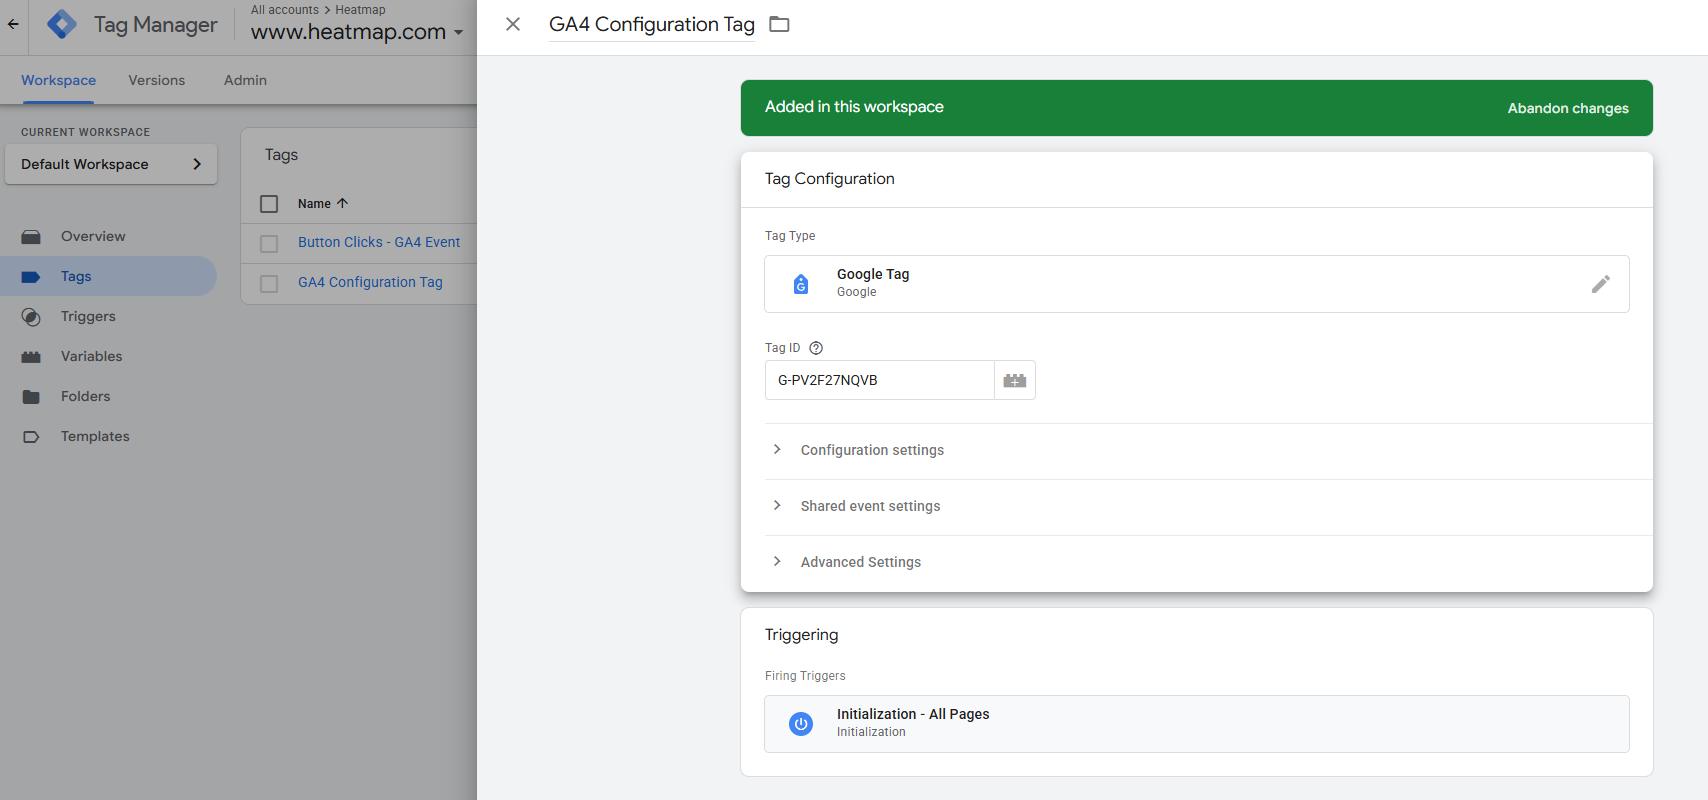
Creating a GA4 configuration tag:
- In GTM, go to Tags > New > Google Tag
- Name it: GA4 Configuration Tag
- Enter your Measurement ID (G-XXXXXXXX)
- Set to fire on All Pages
- Save the configuration tag
Setting up ecommerce event tags:
- Create a new tag: Google Analytics: GA4 Event
- Add your GA4 Configuration tag
- Enter "purchase" as the Event Name
- Under Event Parameters, add:
- transaction_id (from dataLayer)
- value (from dataLayer)
- currency (from dataLayer)
- For items array, use {{ecommerce.items}} variable
Configuring triggers for purchase events:
- Create a Custom Event trigger
- Set Event name to "purchase"
- This will fire when your dataLayer purchase event is pushed
- Test using GTM's Preview mode to ensure proper firing
With GTM properly configured, your purchase events will be sent to GA4 whenever a transaction occurs on your site.
Step 4: Configure the DataLayer for Ecommerce Events
The dataLayer is where your ecommerce data lives before being sent to GA4. Proper implementation is critical:
DataLayer structure for purchase events:
- Always clear previous ecommerce objects first
- Include all required parameters (transaction_id, value, currency, items)
- Structure must match GA4's expected format
Clearing previous ecommerce data:
dataLayer.push({ ecommerce: null });
Example code snippets: For a complete purchase event:
dataLayer.push({
  event: 'purchase',
  ecommerce: {
    transaction_id: 'ORDER_12345',
    value: 99.97,
    tax: 9.00,
    shipping: 5.99,
    currency: 'USD',
    coupon: 'SUMMER_SALE',
    items: [{
      item_id: 'SKU_12345',
      item_name: 'Product Name',
      price: 29.99,
      quantity: 3,
      item_category: 'Category',
      item_variant: 'Variant',
      coupon: 'PRODUCT_COUPON'
    }]
  }
});
This dataLayer push should be triggered on your order confirmation page, with dynamic values pulled from your ecommerce platform.
Step 5: Test Your Implementation with DebugView
Before relying on your GA4 revenue data, thorough testing is essential:
Accessing DebugView in GA4:
- In GA4, go to Admin > DebugView
- Enable debug mode in your browser:
- Use the Google Analytics Debugger extension
- Or add ?debug=true to your URL
Verifying purchase events fire correctly:
- Complete a test purchase on your site
- Check DebugView to confirm the purchase event appears
- Verify all parameters are present and correctly formatted
- Pay special attention to the items array structure
Troubleshooting common issues:
- Missing parameters: Check your dataLayer implementation
- Duplicate events: Ensure you're clearing the ecommerce object
- Incorrect values: Verify data types (numbers should be numeric, not strings)
- Events not firing: Check your GTM trigger configuration
DebugView provides real-time feedback on your implementation, making it invaluable for troubleshooting.
Step 6: Mark Purchase Events as Conversions
To properly track purchases as conversions in GA4:
Navigating to conversion settings:
- Go to Admin > Events > Conversions
- Click the "New conversion event" button
- Enter "purchase" as the event name
- Save the conversion event
Setting up purchase as a key conversion event:
- Once marked as a conversion, purchase events will be counted in conversion reports
- This enables attribution reporting for purchase events
- Conversion rate will be calculated based on these events
Importance for attribution reporting:
- Proper conversion setup allows you to see which channels drive purchases
- Enables multi-touch attribution models
- Provides insights into the customer journey leading to purchase
With purchase events marked as conversions, you'll gain access to more detailed reporting on how users convert on your site.
Step 7: Create Custom Reports for Revenue Analysis
GA4's standard reports may not provide all the insights you need. Custom reports fill this gap:
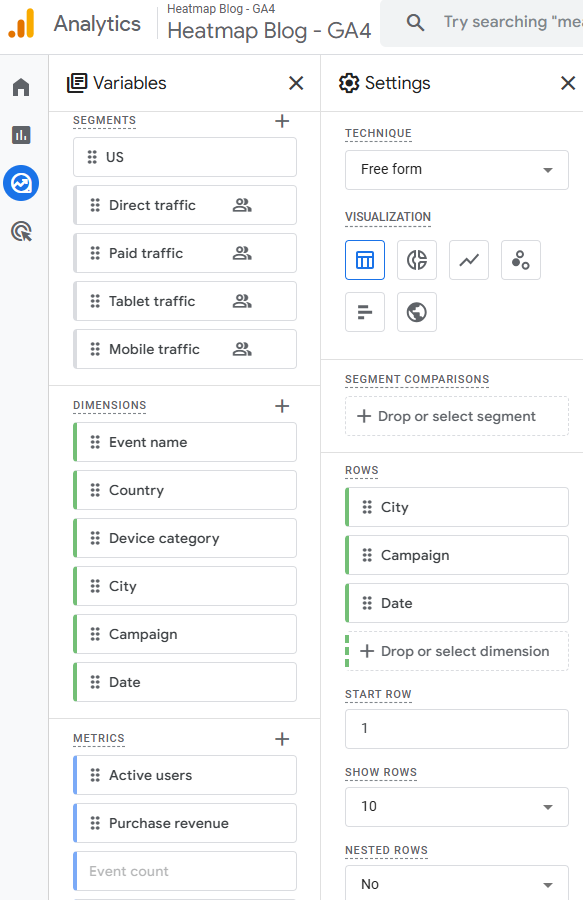
Building monetization reports:
- Go to Explore > Create a new exploration
- Select an appropriate template (Free form is versatile)
- Add dimensions like:
- Date
- Source/Medium
- Event name
- Add metrics like:
- Purchase revenue
- Transactions
- Average purchase revenue per user
Setting up ecommerce dashboards:
- Create a dashboard with key revenue metrics
- Add visualizations for:
- Revenue trends over time
- Top-selling products
- Revenue by marketing channel
- Average order value trends
Configuring custom dimensions and metrics:
- Go to Admin > Custom definitions
- Create custom dimensions for additional data points:
- Customer type (new vs. returning)
- Membership tier
- Product category performance
Custom reports provide the flexibility to analyze your revenue data in ways that standard reports can't match.
P.S., Setting up GA4 revenue tracking can take 20-40 hours of developer time, and even then, data accuracy issues often persist. heatmapAI offers out-of-the-box revenue tracking without custom code requirements, saving both time and development resources while providing more accurate data.

Common GA4 Revenue Tracking Challenges and Solutions
Even with careful implementation, GA4 revenue tracking often presents challenges. Here's how to identify and resolve the most common issues.
Missing or Incomplete Revenue Data
One of the most frustrating issues is when revenue data simply doesn't appear in GA4 reports:
Causes:
- Incorrect parameter implementation: Missing required fields like transaction_id or value
- Missing transaction IDs: Each transaction needs a unique identifier
- Data structure problems: Improperly formatted items array
- Currency mismatches: Currency parameter doesn't match property settings
Solutions:
- Review your dataLayer implementation against GA4 requirements
- Ensure all required parameters are present and correctly formatted
- Verify transaction IDs are unique for each purchase
- Check that currency codes match your GA4 property settings
Debugging techniques:
- Use DebugView to see real-time event data
- Implement console.log() statements to verify dataLayer pushes
- Use the Tag Assistant Chrome extension to validate events
- Check the Network tab in browser dev tools to confirm data is being sent
Systematic testing of your purchase flow can help identify exactly where data is being lost or malformed.
Data Discrepancies Between GA4 and Your Platform
It's common to see differences between GA4 revenue figures and your ecommerce platform:
Why GA4 often reports higher revenue:
- GA4 tracks gross revenue by default (before returns/refunds)
- Different attribution windows between systems
- GA4 may count test orders or internal purchases
- Duplicate transaction IDs can lead to double-counting
How to reconcile differences:
- Compare transaction counts first, then revenue totals
- Look for specific transactions that appear in one system but not the other
- Check for duplicate transaction IDs in GA4
- Verify that refunds are properly tracked in GA4
Setting up custom parameters for accurate reporting:
- Implement refund events with the same transaction_id as the original purchase
- Add custom parameters to flag test orders
- Consider creating a custom dimension for net revenue calculation
A certain amount of discrepancy (5-10%) is normal due to tracking differences, but larger gaps indicate implementation issues.
P.S. GA4 inflates revenue by reporting gross sales without accounting for discounts or promotions, typically showing 15-20% higher figures than actual cash collected. heatmapAI tracks net revenue automatically, ensuring your analytics reflect real customer spending for more accurate decision-making.
High Event Volumes and Data Sampling Issues
GA4 has limits that can affect large ecommerce sites:
Understanding GA4's limits:
- 500 events per session
- 25 custom dimensions per event
- 25 user properties per user
- Data sampling occurs when query volume is high
Strategies to reduce cardinality:
- Limit the number of unique parameter values
- Avoid using highly variable values (like exact prices) as parameters
- Group similar items into broader categories
- Be selective about which events you track
Working with sampled data effectively:
- Recognize when reports are using sampled data (look for the sampling indicator)
- Reduce date ranges to minimize sampling
- Export raw data to BigQuery for unsampled analysis
- Consider upgrading to GA4 360 for higher limits
For large ecommerce sites, implementing a strategic tracking plan that prioritizes the most important events can help manage data volume.
JavaScript Errors Affecting Data Collection
Technical issues can prevent proper data collection:
Identifying tracking code issues:
- Use browser console to check for JavaScript errors
- Look for dataLayer-related errors specifically
- Verify that GA4 tags are firing in expected sequence
Resolving conflicts with other scripts:
- Ensure GA4 code loads early in the page
- Check for script conflicts with other analytics tools
- Verify that ad blockers aren't preventing tracking
- Test in multiple browsers to identify browser-specific issues
Monitoring implementation health:
- Set up alerts for sudden drops in event counts
- Regularly review DebugView for expected events
- Implement a monitoring solution like Google Tag Assistant
- Schedule periodic audits of your tracking implementation
Regular monitoring helps catch issues early, before they significantly impact your data quality.
Analyzing Sales Data in GA4: Key Reports and Insights
Once your revenue tracking is properly configured, GA4 offers several ways to analyze your sales data.
Monetization Overview Report
This is your starting point for revenue analysis in GA4:
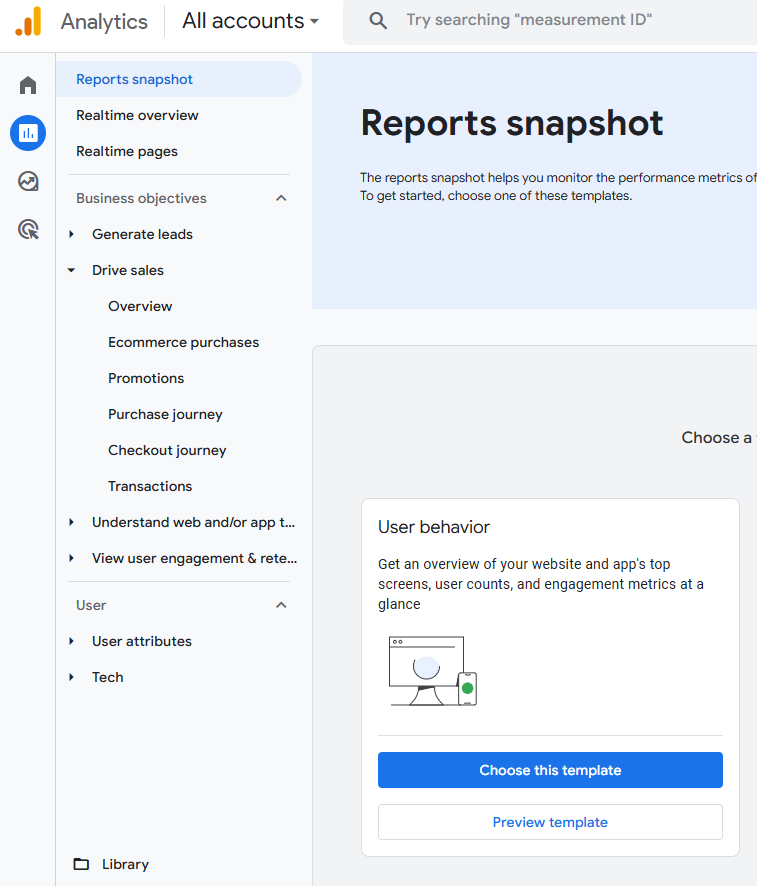
Accessing and interpreting the report:
- Navigate to Reports > Monetization (or Drive sales) > Overview
- View total revenue, average purchase revenue, and total purchasers
- See trends over your selected time period
Key metrics to monitor:
- Purchase revenue: Total revenue from completed purchases
- Average purchase revenue per user: Revenue divided by unique purchasers
- Total purchasers: Count of unique users who completed a purchase
- Purchases per purchaser: Average number of transactions per buying user
Setting up custom comparisons:
- Click the "Add comparison" button
- Compare revenue by dimensions like:
- Device category (mobile vs. desktop)
- Source/Medium (different marketing channels)
- User type (new vs. returning)
These comparisons reveal which segments drive the most revenue for your business.
Ecommerce Purchases Report
For more detailed transaction analysis:
Understanding transaction data:
- Go to Reports > Monetization > Ecommerce purchases
- View purchase trends over time
- See transaction counts and average order values
Analyzing product performance:
- View revenue by product using the Item name dimension
- Compare quantity sold vs. revenue generated
- Identify high-margin vs. high-volume products
Identifying top revenue drivers:
- Add secondary dimensions like Item category
- Sort by purchase revenue to see top performers
- Look for patterns in high-performing products
- Identify underperforming products that may need optimization
This report helps you understand which products contribute most to your bottom line.
User Purchase Journey Analysis
Understanding the path to purchase helps optimize your conversion funnel:
Tracking the path to purchase:
- Create a new Exploration report
- Use the Path exploration template
- Set the starting point as first user engagement
- Set the endpoint as purchase completion
Identifying drop-off points:
- Look for pages with high exit rates before purchase
- Analyze steps where users abandon their journey
- Compare successful vs. abandoned purchase paths
Optimizing the conversion funnel:
- Identify friction points in the checkout process
- Compare conversion rates across different entry points
- Analyze the impact of marketing campaigns on purchase completion
- Test improvements to problematic steps in the funnel
Understanding this journey helps you remove obstacles that prevent purchases.
While GA4's purchase journey reports provide basic insights, they lack visual context about user behavior. heatmapAI's session recordings show exactly where users engage before making purchases, while revenue-based heatmaps tie every click to revenue, revealing drop-off points and key revenue-driving interactions on your website that GA4 simply can't visualize.

Channel Performance for Revenue Generation
Evaluating which marketing channels drive revenue is crucial:
Analyzing marketing channel effectiveness:
- Go to Reports > Acquisition > Traffic acquisition
- Add the "Conversions" tab to see purchase data
- Compare channels by:
- Total revenue generated
- Conversion rate to purchase
- Average order value
Attribution models in GA4:
- Data-driven attribution (default): Uses machine learning to assign credit
- Last click: Gives all credit to the final touchpoint
- First click: Gives all credit to the initial touchpoint
- Linear: Distributes credit equally across all touchpoints
Optimizing channel mix for revenue:
- Identify high-performing channels by revenue per session
- Compare cost per acquisition across channels
- Adjust budget allocation based on revenue contribution
- Test new channels and compare performance
This analysis ensures you're investing in the marketing channels that deliver the best return.
Advanced GA4 Revenue Tracking Techniques
For businesses ready to take their revenue tracking to the next level, these advanced techniques provide deeper insights.
Enhanced Ecommerce Event Configuration
Beyond basic purchase tracking, additional events provide a complete picture:
Adding additional parameters for deeper insights:
- affiliation: Store or brand name
- coupon: Promotion code used
- shipping: Shipping cost
- tax: Tax amount
- discount: Total discount applied
Tracking refunds and returns:
dataLayer.push({ ecommerce: null });
dataLayer.push({
  event: 'refund',
  ecommerce: {
    transaction_id: 'T_12345', // Must match original purchase
    value: 29.99, // Refund amount
    currency: 'USD',
    items: [{
      item_id: 'SKU_123',
      item_name: 'Premium Widget',
      price: 29.99,
      quantity: 1
    }]
  }
});
Implementing coupon and promotion tracking:
dataLayer.push({ ecommerce: null });
dataLayer.push({
  event: 'purchase',
  ecommerce: {
    transaction_id: 'T_12345',
    value: 49.99,
    currency: 'USD',
    coupon: 'SUMMER25', // Order-level coupon
    items: [{
      item_id: 'SKU_123',
      item_name: 'Premium Widget',
      price: 29.99,
      quantity: 1,
      coupon: 'WIDGET10' // Item-level coupon
    }]
  }
});
These additional parameters provide context that enhances your revenue analysis.
Custom Dimensions for Revenue Segmentation
Custom dimensions allow for more sophisticated analysis:
Creating user-scoped dimensions:
- Go to Admin > Custom definitions > Create custom dimensions
- Name your dimension (e.g., "Customer Tier")
- Set scope to "User"
- Enter the parameter name that will contain this data
Event-scoped dimensions for transactions:
- Create dimensions for order-specific data:
- Payment method
- Shipping method
- Gift wrapping status
- Order type (subscription vs. one-time)
Segmenting revenue data effectively:
- Create segments based on custom dimensions
- Compare revenue metrics across segments
- Identify high-value customer groups
- Tailor marketing strategies to different segments
Custom dimensions transform raw revenue data into actionable customer insights.
Explorations for Custom Revenue Analysis
GA4's Exploration reports offer powerful analysis capabilities:
Building advanced revenue reports:
- Go to Explore > Create a new exploration
- Select an appropriate template (Free form, Funnel, etc.)
- Add dimensions and metrics relevant to your analysis
- Create visualizations that highlight key insights
Segment comparisons:
- Compare revenue across different customer segments
- Analyze how different product categories perform by channel
- Contrast new vs. returning customer purchase behavior
Funnel exploration techniques:
- Create a purchase funnel with steps like:
- Product view
- Add to cart
- Begin checkout
- Add payment info
- Purchase
- Compare funnel completion rates across segments
- Identify where different customer groups drop off
These exploration techniques reveal insights that standard reports might miss.
Best Practices for Accurate GA4 Revenue Data Collection
Ensuring your GA4 data is accurate and reliable requires ongoing attention to these best practices.
Regular Auditing and Validation
Consistent verification keeps your data trustworthy:
Comparing GA4 data with your platform:
- Create a regular schedule for data comparison (weekly or monthly)
- Compare key metrics:
- Transaction count
- Total revenue
- Product-specific revenue
- Document and investigate discrepancies over 10%
Scheduled verification processes:
- Set up automated alerts for unusual data patterns
- Create a dashboard comparing platform data to GA4
- Schedule regular technical audits of your implementation
Data quality maintenance:
- Review DebugView periodically to ensure events are firing correctly
- Check for duplicate transaction IDs
- Verify that all required parameters are present in events
Regular auditing catches issues before they significantly impact your analysis.
Avoiding Common Implementation Mistakes
These pitfalls often lead to data quality issues:
Parameter formatting issues:
- Ensure numeric values are sent as numbers, not strings
- Verify that arrays are properly formatted
- Check that all required fields have values
Currency consistency:
- Always include the currency parameter with monetary values
- Ensure currency codes match your GA4 property settings
- Be consistent with currency formatting across events
Transaction ID uniqueness:
- Generate truly unique IDs for each transaction
- Include store/channel identifiers if necessary
- Implement server-side validation of transaction IDs
Avoiding these common mistakes significantly improves data quality.
Optimizing for Real-Time Decision Making
GA4's reporting delays can be challenging for time-sensitive decisions:
Working around GA4's reporting delays:
- Use DebugView for immediate verification of events
- Implement real-time alerting for critical metrics
- Consider supplementary tools for real-time analytics
Supplementing with real-time tools:
- Use BigQuery streaming exports for near-real-time data
- Implement additional analytics tools focused on real-time data
- Consider custom dashboards that pull from multiple sources
Alert configurations for revenue anomalies:
- Set up custom alerts for significant revenue drops
- Create notifications for unusual transaction patterns
- Implement monitoring for technical issues that affect tracking
These strategies help overcome GA4's inherent reporting delays.
GA4's 24-hour reporting delay makes it impossible to react quickly to revenue issues. heatmapAI, on the other hand, provides real-time data. Obvi, an 8-figure DTC brand, was able to identify and fix a critical CTA placement issue that ultimately led to a 7.8% increase in revenue per session, generating an additional $2.5 million in revenue.

Preparing for a Cookieless Future
Privacy changes continue to impact analytics:
GA4's approach to privacy:
- Designed with privacy in mind (compared to Universal Analytics)
- Uses machine learning to fill data gaps
- Offers consent mode for compliance with regulations
Alternative tracking methods:
- Server-side tagging reduces reliance on client-side cookies
- First-party data collection becomes more important
- User ID implementation helps maintain user identity
Future-proofing your revenue tracking:
- Diversify your analytics stack
- Focus on owned channels and first-party data
- Implement server-side tracking where possible
- Consider privacy-focused analytics alternatives
These preparations ensure your revenue tracking remains effective as privacy regulations evolve.
Simplifying Revenue Tracking: When to Consider GA4 Alternatives
While GA4 offers powerful capabilities, it's not always the best solution for every business.
Signs You Need a More Streamlined Solution
Consider alternatives if you experience these challenges:
Excessive setup time requirements:
- Implementation taking weeks rather than days
- Constant troubleshooting of tracking issues
- Difficulty maintaining accurate data
Ongoing data accuracy issues:
- Persistent discrepancies with platform data
- Missing or duplicate transactions
- Sampling problems affecting analysis
Resource constraints for maintenance:
- Limited technical resources for implementation
- Lack of analytics expertise for proper configuration
- Insufficient time for regular auditing and validation
These signs indicate that GA4 might be creating more problems than it solves for your business.
Key Features to Look for in Analytics Alternatives
When evaluating alternatives, prioritize these capabilities:
Out-of-the-box revenue tracking:
- Works without extensive configuration
- Automatically captures purchase data
- Integrates easily with your ecommerce platform
Real-time data capabilities:
- Immediate visibility into revenue metrics
- No processing delays for critical data
- Ability to react quickly to issues
User behavior visualization:
- Heatmaps showing where users engage
- Session recordings to understand purchase journeys
- Visual representations of conversion funnels
Accurate net revenue reporting:
- Tracks actual revenue after discounts and returns
- Matches your platform's financial data
- Provides reliable metrics for business decisions
The right alternative should simplify your analytics while providing the insights you need.
Enhance Your GA4 Revenue Tracking With heatmapAI
GA4 revenue tracking is powerful but complex. The key is finding the right balance between comprehensive data and practical implementation.
Properly configured GA4 can provide valuable insights into your sales performance, customer behavior, and marketing effectiveness. However, the technical requirements and ongoing maintenance shouldn't be underestimated.
Key Takeaways for Better Revenue Tracking
- Prioritize proper implementation - Take the time to set up your purchase events correctly with all required parameters
- Regularly validate your data - Compare GA4 figures with your platform data to ensure accuracy
- Use advanced features selectively - Focus on the metrics and reports that drive actual business decisions
- Consider your resource constraints - Be realistic about your team's capacity to implement and maintain complex tracking
Try heatmap.com | Your eCommerce site will thank you (so will your wallet)
We are the only onsite analytics platform that tells you how to make more money - down to the pixel. Trusted by 1000+ eCommerce brands.

Ashvin Melwani
@ashvinmelwaniWith heatmap, I've been able to figure out what elements actually increase AOV and optimize our landing pages to drive more first purchase profitability, we're up 23% YoY.

How You Can Do It:
1: Download heatmap
2: Wait for 5k sessions
3: Reorganize products based on the highest revenue per session from top left to bottom right.

Founder of heatmap, SplitTesting.com, and multiple ecommerce brands. Lifelong optimizer, CRO-lover, and data nerd.


You made it all the way down here?
Might as well give us a shot, right? It'll change the way you approach CRO. We promise. In fact, our friend Nate over at Original Grain used element-level revenue data from heatmap to identify high-impact areas of his website to test, resulting in a 17% lift in Revenue per Session while scaling site traffic by 43%. Be like Nate. Try heatmap today.
