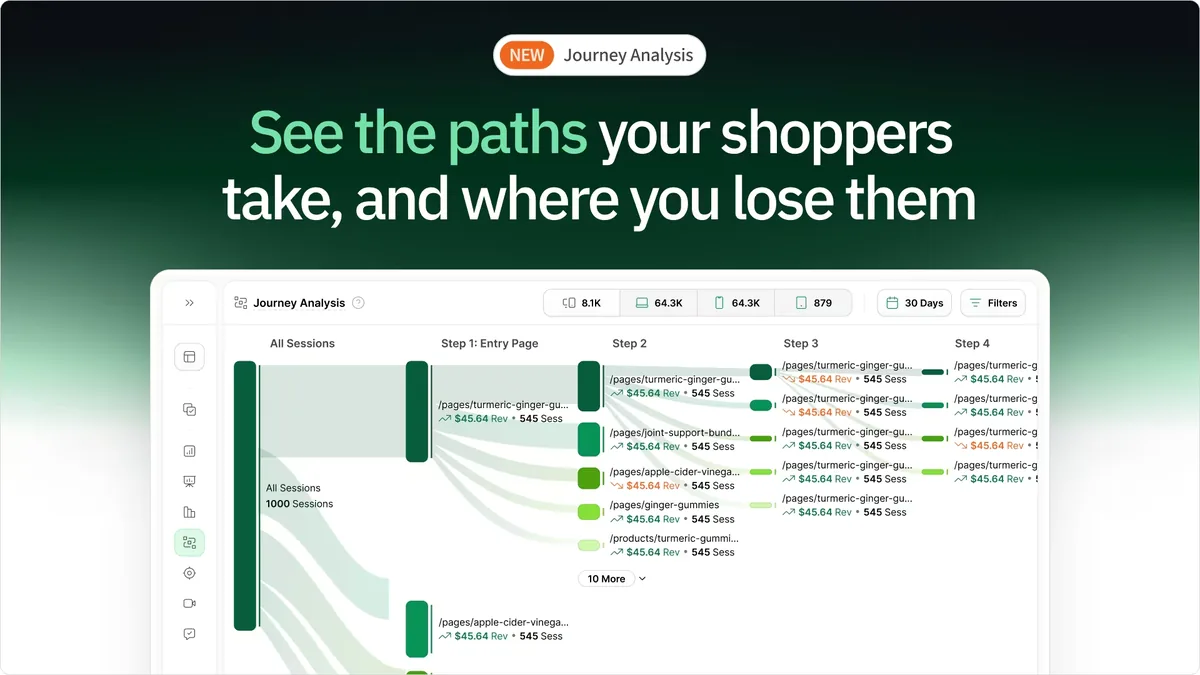
Ever wondered why visitors leave without converting? Google Analytics shows numbers, but heatmaps reveal user behavior visually. Businesses using heatmaps see up to 25% better conversions.
Let’s explore how to set up a Google Analytics account, heatmaps, smarter alternatives of page analytics extension, and actionable tips to optimize your site effectively with this powerful tool.
TL;DR: How to Create a Google Analytics Heatmap (2025)
- GA4 lacks built-in heatmaps – You need third-party tools to visualize user interactions.
- Heatmaps track user behavior – See where website visitors click, scroll, and drop off.
- HeatmapAI is a better alternative – Ties clicks to revenue, detects rage clicks, and provides AI-driven CRO insights.
- Easy setup with HeatmapAI – Install, collect visitor data, and optimize pages for conversions.
- Ditch the guesswork – Try HeatmapAI free for 14 days and start making data-backed decisions.
What is a heatmap in data analytics
A heat map is a visual representation of how users interact with your website. It highlights the most and least engaged areas using colors—red for high engagement, blue for low—making it easier to identify patterns in user behavior. Instead of sifting through rows of numbers in your google analytics heat of tool, google analytics heatmaps can simplify data analysis with a quick glance.
These heatmaps help you answer critical questions:
- Where do website visitors click the most?
- How far do they scroll on a page?
- Which elements grab (or fail to grab) attention?
This information isn’t just trivia—it drives actionable changes, like redesigning layouts, repositioning CTAs, and fixing underperforming sections. By visualizing user behavior detailed visitor data insights, heatmaps turn raw numbers into valuable insights.
Is there a heatmap in Google Analytics 4 (GA4)
The short answer? No.
GA4 doesn’t offer a built-in website heatmap page analytics extension feature. Google retired the google analytics heat show feature from the old Page Analytics chrome extension in 2019, leaving users to rely on third-party tools for this functionality. While GA4 excels at tracking user events and conversion funnels, it falls short when it comes to visualizing click data directly on a web page.
But all is not lost. With a bit of creativity (and the right tools), you can still unlock aggregated user insights using GA4 data. Here’s how:
- Set up Google Analytics account and export GA4 data and create custom reports using tools like Excel or Google Sheets.
- Integrate GA4 with a heatmapping tool like heatmap.com for real-time visuals and revenue-focused insights.
- Use a third-party tracking code to sync heatmap data with your GA account.
While GA4 lacks native heatmaps, combining it with external tools ensures you won’t miss out on the big picture when analyzing user behavior.
Read Next:
Why do GA users still want heat maps
Google Analytics provides a visual overview of a mountain of website data, but numbers alone don’t tell the full story. A google analytics heat map visualizes click data and makes it easier to see why certain pages perform well while others struggle.
Instead of just knowing that a page has a high bounce rate, a google analytics heat map helps answer: Where did users lose interest in page analytics? What stopped them from clicking?
Here’s why GA users still rely on heatmaps:
- Faster, visual insights – Numbers in a pivot table? Hard to interpret. A visual representation of user engagement? Much easier. Heatmaps instantly show problem areas that could take hours to uncover with traditional Google Analytics data.
- Fix conversion roadblocks – If users click on non-clickable elements or stop scrolling before reaching a CTA, you’re losing conversions. A heat map highlights exactly where visitors are dropping off, helping to adjust page layouts, CTAs, and content placement.
- Optimize marketing campaigns – A well-placed button can make or break an ad campaign. With user behavior heatmaps, marketers can test different page versions, see which layout gets the most engagement and conversions to improve marketing campaigns heatmaps.
GA4 is powerful, but it lacks heat-mapping capabilities. That’s why many GA users turn to third-party tools like Hotjar, Lucky Orange, and heatmap.com to fill the gap and visualize click data.
Read next:
The next best (better) thing: Use heatmapAI to set up a heat map
Google Analytics might give you numbers, or page analytics icon but it won’t show you how users actually behave on your site. That’s where HeatmapAI comes in.
Instead of just tracking pageviews, the full page analytics chrome extension called HeatmapAI ties every click to increased revenue, giving you actionable insights form page analytics that go beyond standard website traffic data.
Here’s why HeatmapAI is the better choice for setting up a heat map:
- Revenue-Based Heatmaps – See exactly which page elements drive conversions, not just where people click.
- AI-Powered Insights – Get automated recommendations to optimize layout, CTAs, and product placements.
- Scrollmaps & Session Recordings – Identify drop-off points and bottlenecks so you know what’s working (and what’s losing you money).
- Comparison Mode – Track customer satisfaction - how different customer segments interact, helping you refine A/B tests and marketing strategies. Whether it has extension's segment drop down or not.
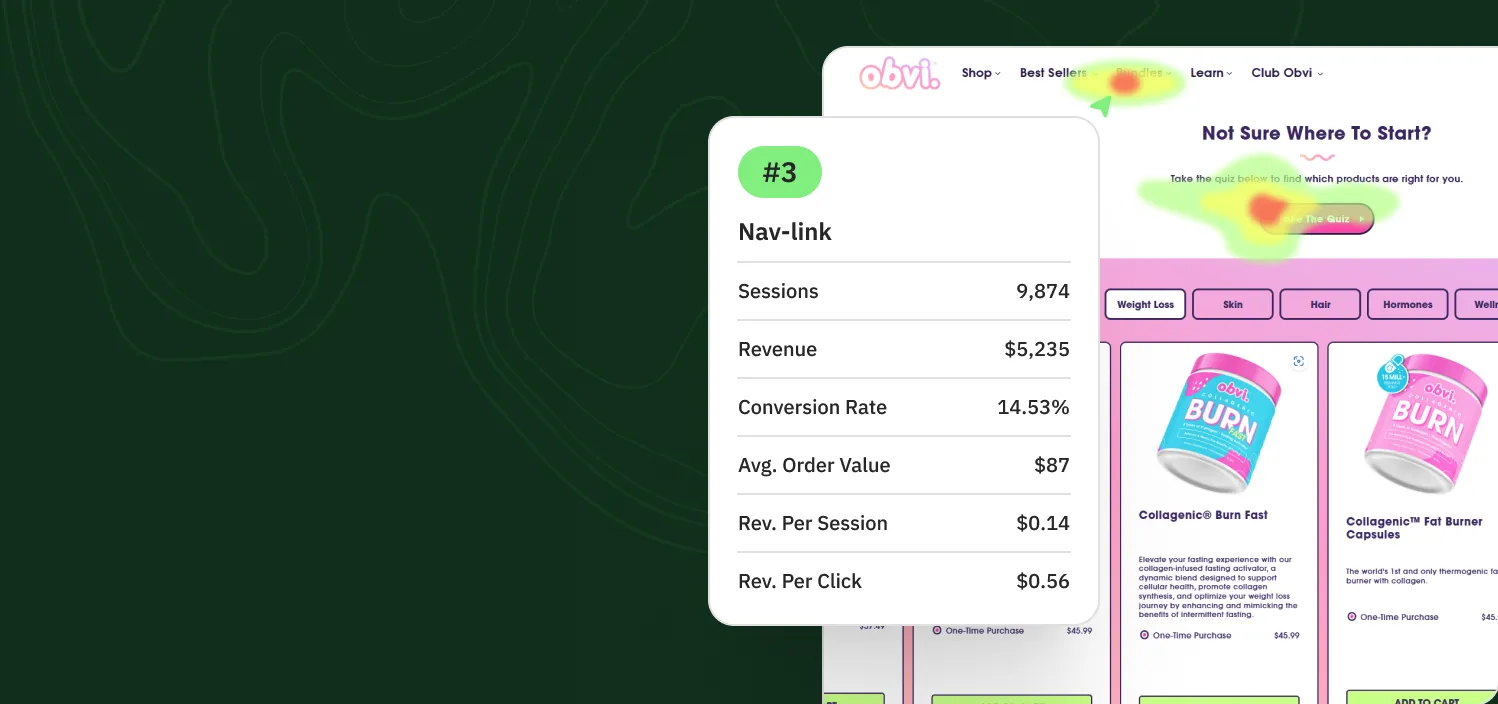
Obvi Added $2.5M Revenue in Their First Month with heatmapAI
By using heatmapAI, Obvi addressed a common challenge for scaling DTC brands: balancing growth and profitability. They leveraged actionable insights to identify which elements increased AOV and optimized landing pages to drive more first-purchase profits.
100x
ROI with Obvi's first month using heatmap
$2.5M
in added revenue using our CRO recommendation engine
+7.81%
Increase in Revenue Per Session
How to Set Up a Heat Map with HeatmapAI
Setting up a full heatmap data and a full heatmap reports and a heat map too, shouldn’t require coding knowledge or hours of manual setup.
HeatmapAI makes the process effortless—allowing you to set up universal analytics, see user interactions in real time and then optimize future campaigns based on what actually drives revenue. Here’s how you can get started:
Step 1: Install the HeatmapAI Script (takes under 10 minutes)
The first step is to integrate HeatmapAI with your website. This takes just a few minutes:
- Sign up for a free trial on Heatmap.com.
- Copy the JavaScript tracking code provided in your dashboard.
- Paste it into your website’s header (or use Google Tag Manager for easy deployment).
- If you’re on Shopify, WordPress, or another CMS, HeatmapAI provides one-click installation via plugins or integrations.
Once installed, HeatmapAI immediately starts collecting visitor data—no extra configuration needed.
Step 2: Gather Session Data & User Behavior Insights
HeatmapAI automatically tracks visitor interactions across the page views your website, giving this an analytics feature and extension to your website visitors give you insights into visitor behavior:
✅ Click Maps – See where users click the most (and where they ignore).
✅ Scroll Maps – Identify how far users scroll before dropping off.
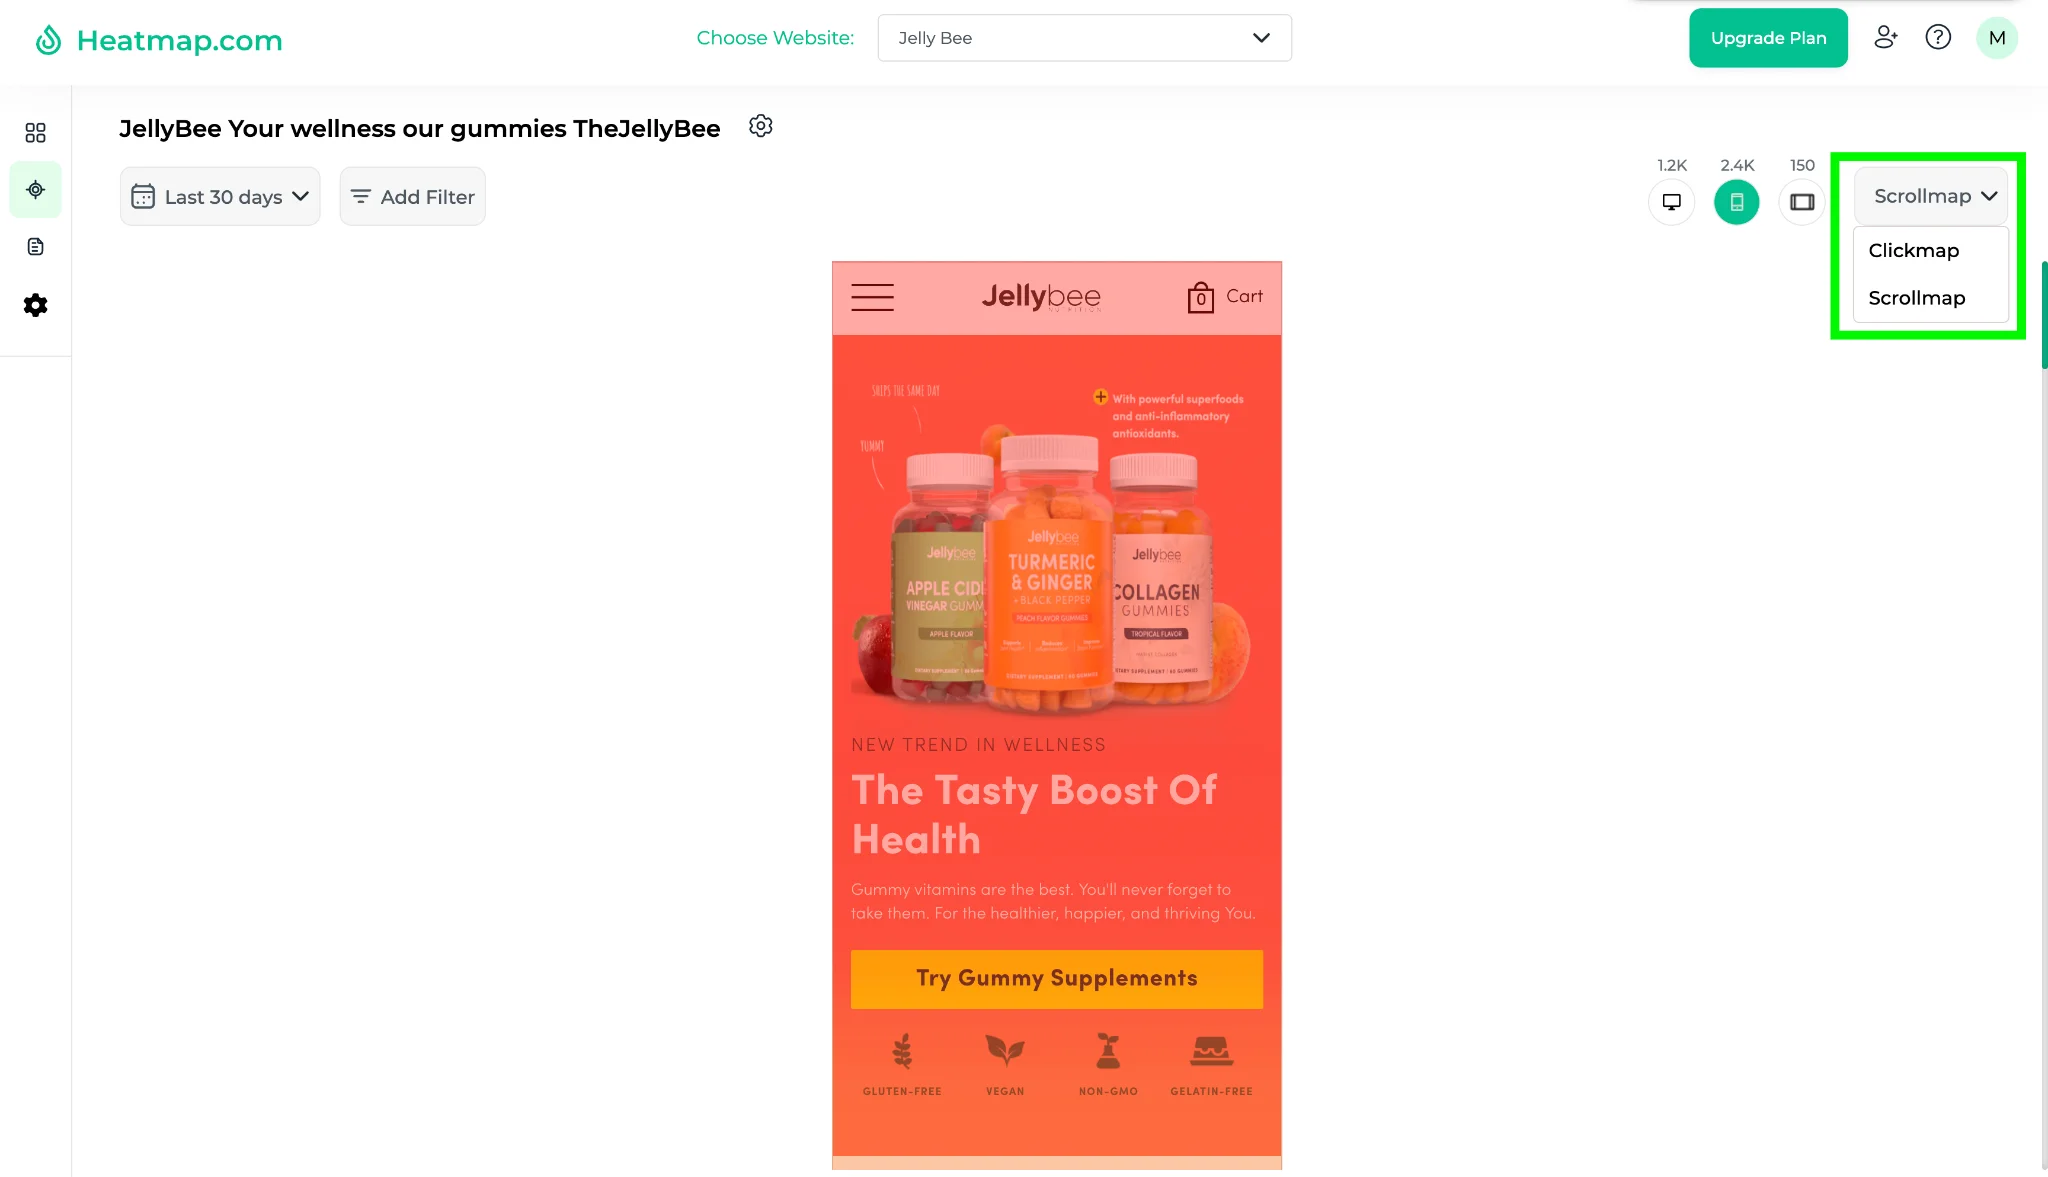
✅ Session Recordings – Watch real visitor journeys to make page analytics make website visitors spot friction points.
✅ Revenue Heatmaps – Find out which elements drive the most sales and engagement.
You don’t just get raw data—you get AI-powered insights that tell you how much room between what needs fixing and what’s already working well.
Step 3: Analyze, Optimize & Increase Conversions
Once enough data is collected, HeatmapAI helps you turn the data collected into insights and visualize data into action:
- Use comparison mode to analyze different audience segments (e.g., high spenders vs. bounce-prone visitors).
- Identify underperforming CTAs, product placements, and layout issues that impact conversion rates.
- Run A/B tests backed by real user behavior—not just assumptions to track all sort of data, be it revenue per session or any other website heatmap data
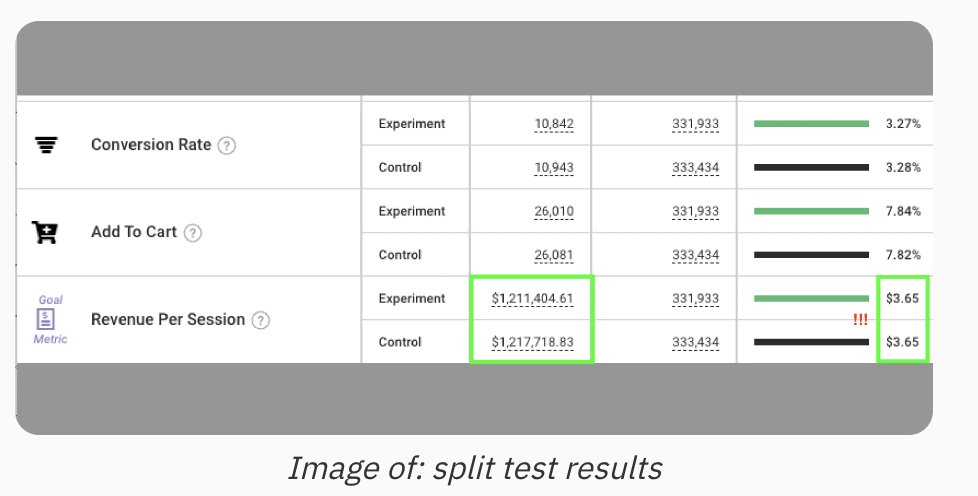
- Track Revenue Per Session (RPS) to see which page changes actually drive more sales.
Step 4: Continuously Improve with AI Recommendations
HeatmapAI doesn’t just collect data—it gives AI-driven optimization suggestions to:
🚀 Move high-performing elements into better positions.
🎯 Adjust layouts based on revenue heatmaps.
💡 Fix pages with high drop-offs.
With continuous tracking and AI-powered insights, you can refine your website’s performance, improve user experience, and boost conversions.
Why teams choose heatmap.com over other analytics tools

Read more:
Why GA Users Are Making the Switch to HeatmapAI
Google Analytics is great for tracking what happens on your website. It tells you how many visitors land on a particular page or web page at first, where they come from, and what pages they exit from.
But it doesn’t tell you why they leave, hesitate, or abandon their carts.
That’s where HeatmapAI comes in.
Instead of making assumptions based on high bounce rates and low conversion rates, HeatmapAI shows you the exact reasons behind user behavior.
The Problem with Google Analytics Alone
Google Analytics provides quantitative data, meaning it tells you the numbers but the data sampling lacks qualitative insights and context:
- High bounce rate? GA won’t tell you if visitors leave because of slow load times, confusing layouts, or weak CTAs.
- Drop-off before checkout? GA won’t show you if users are rage-clicking on an unclickable element or getting frustrated with form fields.
- Low conversion rates? GA won’t reveal if your key elements, like buttons or banners, are going unnoticed.
Essentially, GA tracks activity, but not intent. It’s like knowing your store has 1,000 visitors a day but having no idea why they leave without buying.
How HeatmapAI Fills the Gaps?
Heatmap data analytics tool gives you a visual, behavior-based analysis that answers critical questions:
✅ Which elements of chrome web store or website page get the most attention? (Click Maps)
✅ Where in web page and page views, do users stop scrolling? (Scroll Maps)
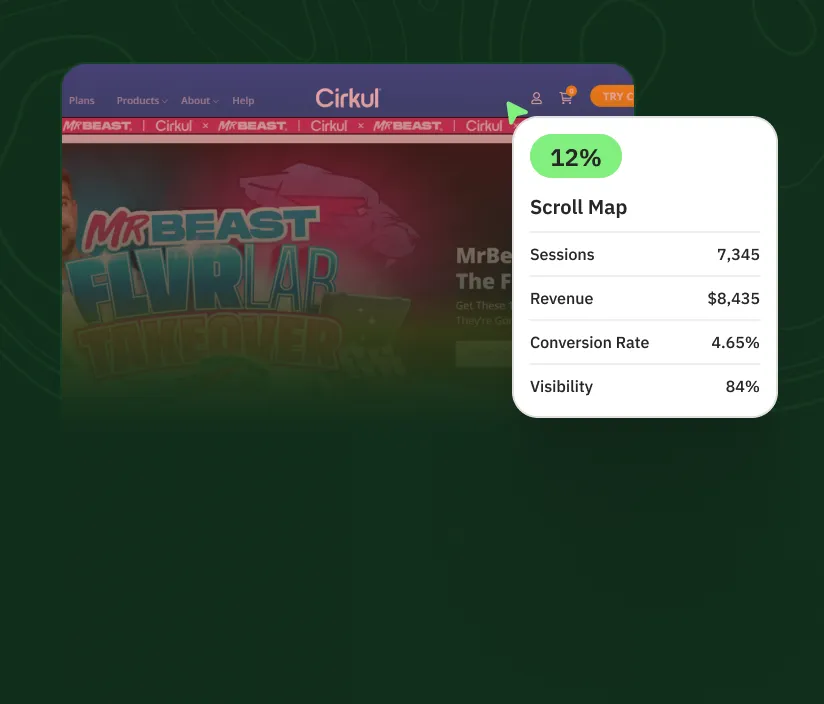
✅ Which actions lead to revenue? (Revenue-Based Heatmaps)
✅ What frustrates visitors? (Rage Click Tracking & Session Replays)

💡 Example: Say your pricing page has a 70% bounce rate in your Google Analytics data.
HeatmapAI might show that users rage-click on an unresponsive FAQ section or never scroll down far enough to see the discount code. Instead of guessing what users interact with, you now have a clear action plan—fix the FAQ and adjust the layout.
The benefits GA Users get after switching to Heatmap:
| GA | heatmapAI |
|---|---|
| GA tracks visitors. | heatmapAI tracks revenue. Instead of optimizing for traffic, you optimize for profitability. |
| GA shows sessions. | heatmapAI shows user journeys. Watch actual session replays to see where visitors get stuck. |
| GA provides numbers. | heatmapAI provides solutions. AI-driven insights tell you exactly what to fix for better conversions. |
👋 What makes heatmap different: Heatmap excels in providing accurate data by filtering out "fake" traffic and preventing missed sessions, ensuring reliable insights. Its AI-powered tools deliver actionable, data-driven recommendations. Users value its prompt customer support and clear, competitive pricing with no hidden charges. The easy-to-use interface simplifies navigation, making it an accessible option for teams of any size to analyze data effectively.
Try HeatmapAI free for 14 days and get real, revenue-driven insights—not just data points.
Read next: Level-Up Your Heatmap Analysis for High-Converting UX
See What Your Website is Really Telling You with HeatmapAI
You’ve made it this far—now you know exactly how to set up a Google Analytics heatmap and why traditional a google analytics heatmap works, using alone isn’t enough.
By using google analytics heatmaps to map and combining quantitative data with user behavior insights, you can stop guessing and start making data-backed decisions that improve your site’s engagement, conversions, and revenue.
With HeatmapAI, You Get More Than Just Click Data
- See revenue impact: Find out which clicks actually lead to sales, not just visits.
- Spot problem areas instantly: Identify frustration points with rage-click tracking and session replays.
- Make smarter optimizations: AI-powered insights suggest exact fixes to increase conversions.
HeatmapAI doesn’t just show you where users click—it shows you why they stay, why they leave, and what drives revenue. Whether you’re optimizing an eCommerce store, a SaaS platform, or a lead-gen site, HeatmapAI gives you the real insights you need to grow.
Read next: How heatmap Generated $600,000 for a client
👉 Try HeatmapAI Free for 14 Days and start turning clicks into conversions today.
💡 heatmap doesn’t have a negative impact on your site speed. Our dual-snippet approach ensures lightweight tracking (under 10KB) and asynchronous loading, preventing slowdowns. A formal A/B test on a 9-figure brand proved zero impact on performance or revenue. Plus, we’re the only onsite analytics platform that also tells you how to IMPROVE your current site speed with our AI-powered CRO recommendation engine 😉
Read next:

Dylan AnderPublished December 1, 2025