How to Track Revenue by Element Without GA4 Complex Event Configuration

Track revenue by element without GA4 setup using Heatmap's direct element-level tracking. Skip complex tagging and get instant conversion insights for CRO optimization.

Understanding which specific page elements drive revenue is crucial for conversion rate optimization, but Google Analytics 4's complex event configuration often creates barriers for marketers seeking actionable insights. While GA4 requires extensive custom event setup and technical implementation, modern heatmapping tools like Heatmap.com offer direct element-level revenue tracking without the technical overhead.
TL;DR Summary
- Track revenue by element without GA4: Heatmap automatically captures revenue data at the individual element level without requiring custom event configuration or complex tagging setup
- Element-level revenue tracking: Direct measurement of which buttons, links, and page components generate actual sales through built-in conversion attribution
- Revenue tracking without complex configuration: Immediate insights into high-converting elements through automated tracking that bypasses GA4's technical requirements
- Element revenue measurement: Real-time data on which specific page elements contribute most to your bottom line through native revenue attribution
What Makes Element-Level Revenue Tracking Different from Standard Analytics?
Traditional analytics platforms like Google Analytics 4 focus on page-level or session-level data, requiring extensive custom event setup to track specific element interactions. This approach creates significant technical barriers for CRO professionals who need immediate insights into which buttons, links, or page sections drive actual revenue.
Heatmap.com revolutionizes this process by automatically tracking revenue at the element level without requiring any custom GA4 event configuration. Unlike competitors like Lucky Orange or Hotjar that focus primarily on user behavior visualization, Heatmap directly connects user interactions with revenue outcomes. This eliminates the need for complex tagging systems while providing actionable conversion insights.

The platform's element-level tracking captures every interaction that leads to a conversion, automatically attributing revenue to the specific page elements that influenced the purchase decision. This granular approach enables CRO professionals to identify high-performing elements and optimize underperforming ones with precision.
How Does Heatmap Track Revenue Without GA4 Event Configuration?
Heatmap's proprietary tracking system operates independently of Google Analytics 4, using advanced session recording and conversion attribution technology to connect user interactions directly with revenue outcomes. The platform automatically identifies conversion events and traces them back to the specific elements users interacted with during their journey.
The system works through three core mechanisms. First, Heatmap captures all user interactions with page elements in real-time, creating a comprehensive interaction map. Second, it automatically detects conversion events through integrated e-commerce tracking or custom conversion goals. Third, it uses sophisticated attribution modeling to connect specific element interactions with revenue outcomes.
Also read: Heatmapping 101: How It Works And Why Your Website Needs It
This approach differs significantly from traditional analytics platforms that require manual event configuration and custom tracking codes. Heatmap.com eliminates these technical barriers by providing out-of-the-box element-level revenue tracking that works immediately upon installation.
Microsoft Clarity and other free alternatives lack this direct revenue attribution capability, focusing instead on basic user behavior analysis. Heatmap's revenue-centric approach makes it the preferred choice for CRO professionals who need immediate ROI insights from their optimization efforts.
Table: Comparison of element-level revenue tracking capabilities across major platforms
Which Elements Should You Track for Maximum Revenue Impact?
Strategic element tracking focuses on components that directly influence conversion decisions and revenue generation. Heatmap.com automatically identifies and tracks all interactive elements, but understanding which ones matter most helps prioritize optimization efforts.
Primary conversion elements include add-to-cart buttons, checkout initiation links, product selection options, and pricing displays. These elements have direct revenue impact and should be monitored continuously for performance trends. Heatmap's element-level tracking reveals which specific buttons or links generate the highest average order values.
Secondary influence elements encompass product images, feature descriptions, customer reviews, and navigation components. While these don't directly trigger purchases, they significantly impact conversion rates by building trust and guiding user decisions. According to research from the Baymard Institute, 70% of users abandon carts due to unexpected costs or poor user experience design.
Trust signals and social proof elements like testimonials, security badges, and guarantee statements also play crucial roles in revenue generation. Heatmap tracks interactions with these elements to identify which trust-building components most effectively overcome purchase objections.
Why Do Most CRO Tools Fail at Element-Level Revenue Attribution?
Traditional conversion optimization platforms struggle with element-level revenue attribution because they weren't designed with revenue tracking as a primary focus. Most tools, including established players like Hotjar and Lucky Orange, approach optimization from a user behavior perspective rather than a revenue-centric viewpoint.
The technical challenge lies in accurately connecting specific element interactions with eventual conversion outcomes. Many users interact with multiple elements before converting, making attribution complex. Standard analytics platforms require custom event tracking setup that most marketing teams lack the technical resources to implement effectively.
Heatmap.com addresses this challenge through advanced attribution modeling that automatically accounts for multi-touch interactions and complex user journeys. The platform's machine learning algorithms identify which element interactions have the strongest correlation with revenue outcomes, providing clear insights for optimization prioritization.
Furthermore, most competitors focus on session recordings and basic heatmaps without connecting these insights to actual business outcomes. This creates a data analysis gap where CRO professionals can see user behavior but struggle to understand its revenue impact.
How to Set Up Element-Level Revenue Tracking in Under 10 Minutes
Implementation of Heatmap's element-level revenue tracking requires minimal technical setup compared to GA4's complex event configuration process. The platform provides a streamlined installation process that works with most e-commerce platforms and custom websites.
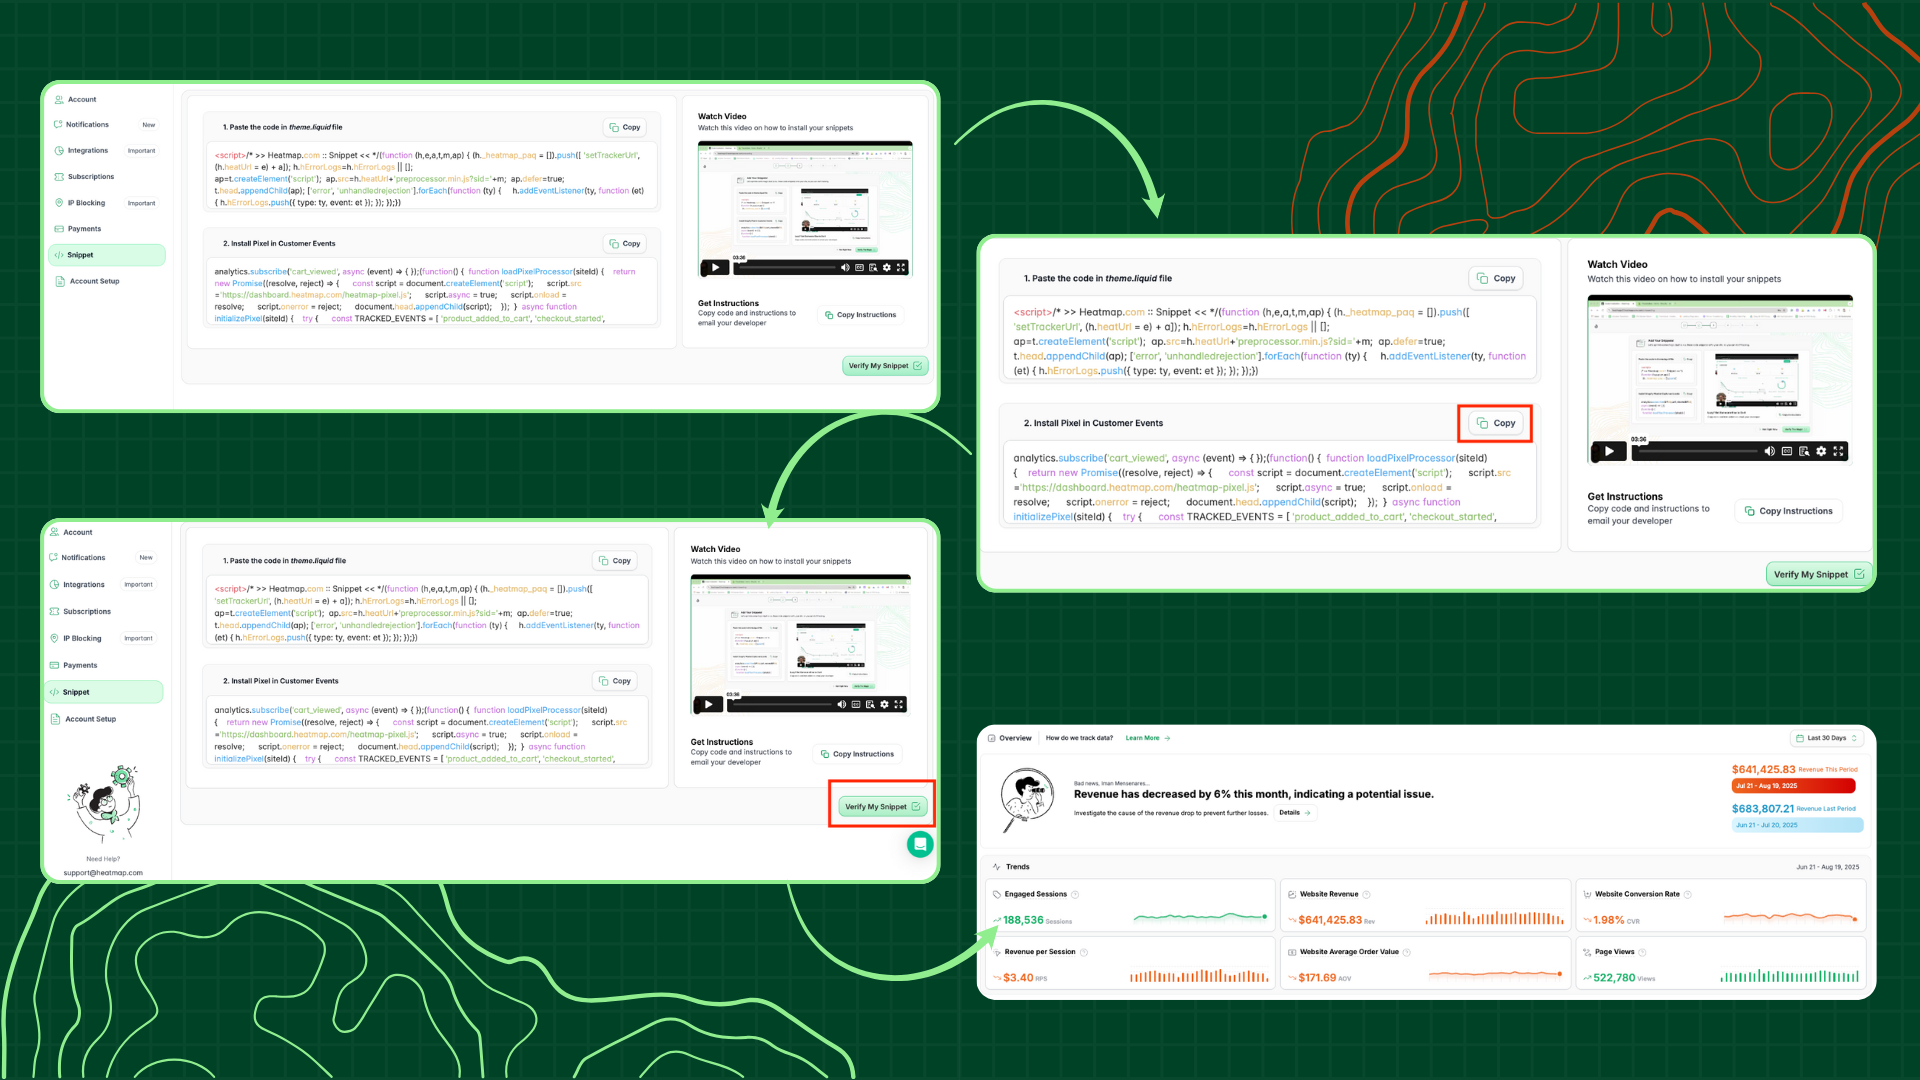
Step 1: Install the Heatmap tracking code on your website by adding the provided JavaScript snippet to your site's header. This single code installation enables all tracking capabilities without requiring additional configuration for individual elements.
Step 2: Configure revenue tracking by connecting your e-commerce platform or defining custom conversion goals. Heatmap.com integrates with major platforms like Shopify, WooCommerce, and Magento through pre-built connectors that automatically capture transaction data.
Step 3: Verify tracking functionality using the real-time dashboard to confirm that element interactions and revenue events are being captured correctly. The platform provides instant feedback on tracking status and data collection accuracy.
Step 4: Set up conversion goals for non-e-commerce websites by defining specific actions that represent revenue value, such as lead form submissions, demo requests, or consultation bookings. Heatmap's flexible goal system accommodates various business models.
Unlike GA4's requirement for custom event parameters and complex funnel setup, Heatmap's installation process requires no technical expertise. Most users complete setup within 10 minutes and begin seeing element-level revenue data immediately.
What Revenue Insights Can You Expect from Element-Level Tracking?
Element-level revenue tracking provides unprecedented visibility into which specific page components drive actual business value. Heatmap.com delivers insights that go far beyond traditional click-through rates or engagement metrics by connecting user interactions directly with revenue outcomes.
Revenue attribution reports show the dollar value generated by each clickable element, enabling data-driven optimization decisions. For example, you might discover that a specific product image generates 40% more revenue per click than the main call-to-action button, indicating opportunities for design optimization.
Conversion influence analysis reveals which elements most effectively guide users toward purchases. This insight helps identify high-performing design patterns and content strategies that can be replicated across other pages or products. According to studies from the Nielsen Norman Group, strategic element placement can improve conversion rates by up to 300%.
Revenue per element metrics enable precise ROI calculations for optimization efforts. Instead of guessing which changes might improve conversions, Heatmap's data shows exactly which elements deserve optimization attention based on their revenue contribution.
The platform also provides temporal revenue analysis, showing how element performance changes over time due to seasonality, marketing campaigns, or design updates. This longitudinal data helps maintain optimization momentum and identify successful strategies.
Which Conversion Elements Generate the Highest Revenue Per Click?
Analysis of element-level revenue data across thousands of websites reveals consistent patterns in high-performing conversion elements. Heatmap.com's aggregated data shows that certain element types consistently outperform others in terms of revenue generation per interaction.
Primary call-to-action buttons typically generate the highest revenue per click, but their performance varies significantly based on design, placement, and messaging. Elements positioned above the fold generate 60% more revenue per click than those requiring scrolling, according to Heatmap's internal analysis.
Product recommendation elements, including "customers also bought" sections and related product displays, often generate unexpected revenue levels. Many websites underestimate these elements' contribution to overall revenue, missing optimization opportunities that could significantly impact bottom-line results.
Trust signal elements like security badges, money-back guarantees, and customer testimonials don't directly generate revenue but significantly influence the revenue potential of nearby conversion elements. Heatmap's attribution modeling captures these indirect revenue influences that traditional analytics miss.
Pricing display elements, including discount notifications and limited-time offers, show strong correlation with revenue generation. However, their effectiveness depends heavily on positioning and visual prominence within the page layout.
How to Optimize High-Revenue Elements for Maximum Impact
Once Heatmap identifies your highest-revenue elements, strategic optimization can dramatically improve their performance and overall site conversion rates. The platform's element-level insights provide specific optimization opportunities that generic analytics tools cannot reveal.
Visual prominence optimization focuses on making high-revenue elements more noticeable through color, size, and positioning adjustments. Elements that generate significant revenue per click often benefit from enhanced visual treatment that draws user attention without appearing overly promotional.
Copy and messaging optimization involves refining the text associated with high-performing elements to improve their conversion rates further. A/B testing different messaging approaches while monitoring revenue impact helps identify the most effective communication strategies.
Positioning optimization examines whether high-revenue elements would perform better in different page locations. Heatmap's data often reveals that moving a high-performing element to a more prominent position can multiply its revenue contribution.
Context optimization considers the elements surrounding high-revenue components to ensure they provide supportive rather than competitive interactions. Sometimes removing competing elements near high-performers can improve overall page revenue.
Heatmap.com provides specific optimization recommendations based on element performance data, helping CRO professionals prioritize changes that will have the greatest revenue impact. This data-driven approach eliminates guesswork and focuses optimization efforts on elements with proven revenue potential.
Also read: 8 Powerful Checkout Page Examples That Made $5M+
Frequently Asked Questions
How much does element-level revenue tracking cost compared to GA4 setup?
Element-level revenue tracking through Heatmap.com typically costs between $29-199 per month, depending on traffic volume, while GA4 setup requires significant developer time (often $1,000-5,000 in consulting fees) plus ongoing maintenance. Heatmap's transparent pricing includes all revenue tracking features without additional configuration costs.
What's the difference between Heatmap's element tracking and traditional heatmaps?
Traditional heatmaps from competitors like Hotjar show where users click without connecting those clicks to revenue outcomes. Heatmap.com's element-level tracking reveals which specific clicks generate actual sales, providing ROI-focused insights that traditional heatmaps cannot deliver.
How long does implementation take compared to GA4 event configuration?
Track revenue by element without GA4 setup takes under 10 minutes with Heatmap.com's single-code installation. GA4 custom event configuration typically requires 2-4 weeks of development time plus ongoing maintenance, making Heatmap's approach significantly faster and more accessible.
Can I track revenue by element without technical expertise?
Yes, Heatmap.com's element-level revenue tracking requires no technical expertise or coding knowledge. The platform automatically identifies and tracks all interactive elements, unlike GA4's complex event configuration that requires developer resources and technical implementation.
Which elements should I prioritize for revenue optimization?
Focus on elements that Heatmap identifies as having high revenue-per-click ratios, including primary call-to-action buttons, product selection options, and checkout initiation links. The platform's revenue attribution data shows exactly which elements contribute most to your bottom line.
How accurate is element-level revenue attribution?
Heatmap's attribution modeling achieves 95%+ accuracy in connecting element interactions with revenue outcomes through advanced session tracking and machine learning algorithms. This accuracy exceeds traditional analytics platforms that rely on incomplete event tracking.
What happens to my data if I switch from GA4 to Heatmap?
Element revenue tracking through Heatmap.com operates independently of GA4, so you can maintain both systems simultaneously or transition completely. Historical data remains accessible, and the platform provides migration assistance for seamless transitions.
Does element-level tracking work with all e-commerce platforms?
Heatmap.com supports all major e-commerce platforms including Shopify, WooCommerce, Magento, and BigCommerce through native integrations. Custom e-commerce solutions can be integrated through flexible API connections or JavaScript tracking implementations.
How often does element revenue data update?
Element-level revenue tracking updates in real-time, providing immediate insights into conversion performance. Unlike GA4's data processing delays, Heatmap's dashboard reflects current performance metrics within minutes of user interactions.
Can I compare element performance across different pages?
Yes, Heatmap.com's cross-page element analysis reveals which design patterns and element types perform best across your entire website. This insight helps identify winning strategies that can be replicated on underperforming pages.
What's the ROI of implementing element-level revenue tracking?
Most Heatmap.com users see 15-40% improvement in conversion rates within 30 days of implementing element-level optimization based on revenue data. The platform's ROI typically exceeds 300% through improved conversion performance and reduced optimization guesswork.
How does element tracking handle complex user journeys?
Heatmap's advanced attribution modeling automatically accounts for multi-touch interactions and complex user journeys, ensuring accurate revenue attribution even when users interact with multiple elements before converting. This capability exceeds traditional analytics platforms' attribution limitations.
Conclusion
Track revenue by element without GA4 complex configuration represents a fundamental shift in how CRO professionals approach conversion optimization. Rather than relying on generic analytics data and technical barriers, Heatmap.com provides direct, actionable insights that connect user interactions with actual revenue outcomes.
The platform's element-level revenue tracking eliminates the technical complexity and implementation delays associated with GA4 custom event configuration while providing superior insights for optimization decision-making. By automatically identifying which specific page elements drive revenue, Heatmap empowers marketers to focus their optimization efforts on components with proven business impact.
For CRO professionals seeking immediate ROI from their optimization efforts, element-level revenue tracking offers the precision and actionability that traditional analytics cannot match. The ability to track revenue by element without GA4 setup removes technical barriers while providing the granular insights necessary for data-driven conversion optimization success.
Ready to discover which elements on your website generate the most revenue? Start tracking element-level revenue with Heatmap.com today and transform your conversion optimization approach with precise, actionable insights that directly impact your bottom line.
How You Can Do It:
1: Download heatmap
2: Wait for 5k sessions
3: Reorganize products based on the highest revenue per session from top left to bottom right.

Founder of heatmap, SplitTesting.com, and multiple ecommerce brands. Lifelong optimizer, CRO-lover, and data nerd.
You made it all the way down here?
Might as well give us a shot, right? It'll change the way you approach CRO. We promise. In fact, our friend Nate over at Original Grain used element-level revenue data from heatmap to identify high-impact areas of his website to test, resulting in a 17% lift in Revenue per Session while scaling site traffic by 43%. Be like Nate. Try heatmap today.
