
Is your site quietly killing conversions?
Fix it fast with our 150-Point CRO Checklist:
• Find out what’s broken
• Learn how to fix it (and turn clicks into cash)
• Use the same tactics that drove $4B+ in ecommerce revenue
Heatmap vs. Hotjar: Connect Every Click to Real Ecommerce Revenue
Hotjar shows you what users do. Heatmap shows you what actually makes you money
GET STARTED FOR FREE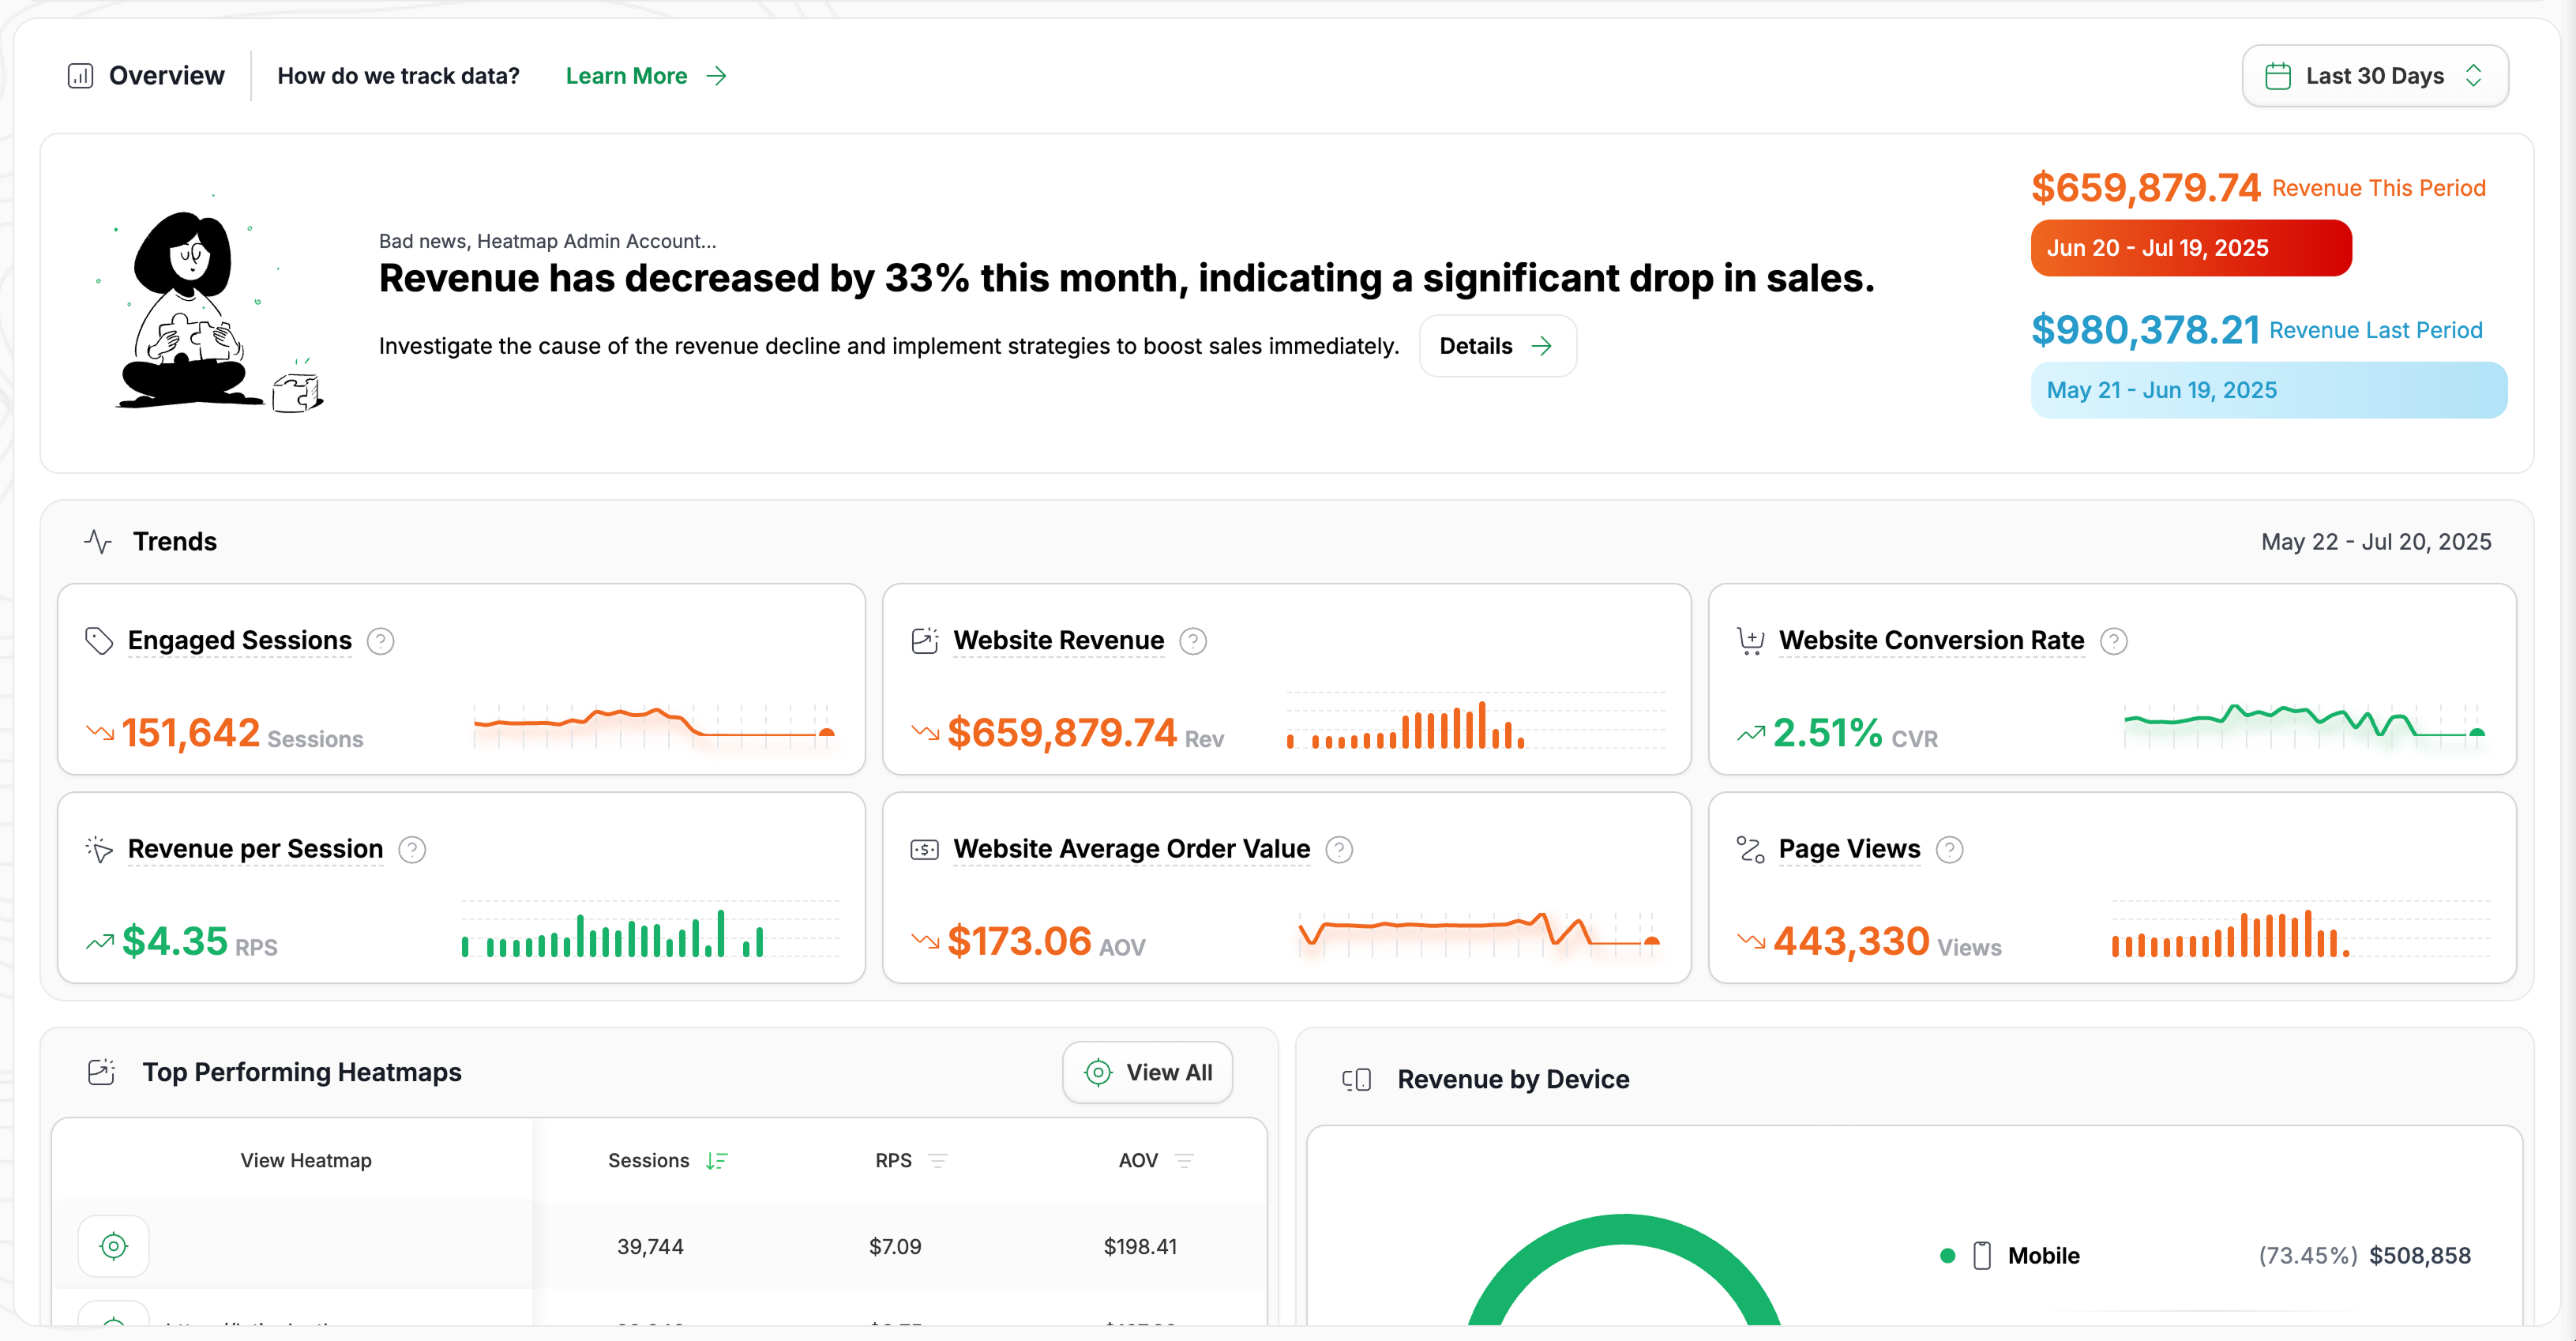

Why Brands Are Switching to Heatmap
You need to deliver personalized digital experiences, but Hotjar just isn’t cutting it.
For Starter
Description can be added here
Free
Additional information can be added here
$3
Additional information can be added here
Automated product tracking, native Shopify/WooCommerce integrations, checkout funnel analysis. Heatmap was made for ecommerce. Hotjar… wasn't
No more playing data detective. Heatmap’s dashboards surface revenue-driving opportunities in plain English so you can take action, fast
Marketing
Turn insights into revenue.
Identify which campaigns drive real results. Heatmap makes it easy for marketers to see how users actually interact with pages—so you can stop guessing and start scaling what works.
Product
Build what people actually use.
Understand exactly where users click, scroll, and drop off. Heatmap helps product teams prioritize improvements based on real behavior—not assumptions.
Data
Data that speaks for itself.
Get visual, intuitive analytics that anyone can use. Heatmap turns raw behavior into actionable clarity, so every team can move fast and make smarter decisions.
Engineering
Ship faster, fix smarter.
Know exactly how users interact with your features—without digging through logs. Heatmap shows engineers where things break, where users get stuck, and what needs fixing, fast.

“I've been able to figure out what elements actually increase AOV and optimize our landing pages to drive more first purchase profitability, we're up 23% YoY.”
.jpeg)
Learn how heatmap can drive growth


Heatmap vs GA4
Discover how Heatmap’s revenue-based heatmaps, scroll maps, screen recordings, and AI insights help eCommerce brands maximize profits.
.avif)
Heatmap vs. Lucky Orange
Ditch generic heatmaps. Compare Heatmap.com vs. Lucky Orange to see how specialized ecommerce analytics drives real revenue and growth.

Heatmap vs. Microsoft Clarity
Ditch generic heatmaps. Compare Heatmap.com vs. Microsoft Clarity to see how specialized ecommerce analytics drives real revenue and growth.
Trusted by DTC Brands That
Care About Profit


.avif)


You made it all the way down here?
Might as well give us a shot, right? It'll change the way you approach CRO. We promise. In fact, our friend Nate over at Original Grain used element-level revenue data from heatmap to identify high-impact areas of his website to test, resulting in a 17% lift in Revenue per Session while scaling site traffic by 43%. Be like Nate. Try heatmap today.
